
Introduction
The Accumulation Swing Index (ASI), developed by Welles Wilder, is a technical analysis tool designed to measure price action and provide a numerical representation of market trends. Unlike simple price indicators, ASI incorporates open, high, low, and close values to generate a comprehensive view of market strength. It is often used to confirm breakouts, identify trend direction, and highlight potential reversals. Traders value ASI because it blends price movement with volatility, offering a more nuanced picture than traditional moving averages or oscillators.
Structure of the ASI
The ASI is built on the Swing Index (SI), which calculates price changes relative to previous highs and lows. The ASI then accumulates these values over time, creating a continuous line that reflects the overall trend.
- Swing Index (SI): Measures the short‑term price movement for each period.
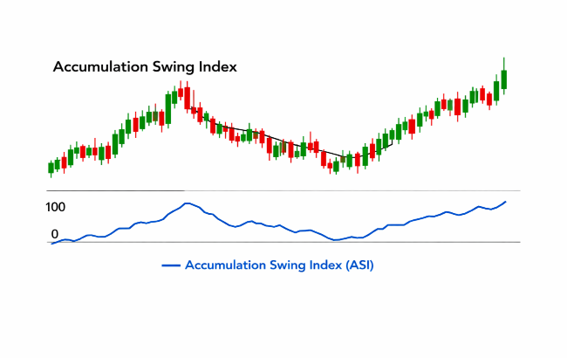
- Accumulation: Adds each SI value to the previous total, forming the ASI line.
- Chart Representation: Typically plotted as a single line oscillating around zero, with positive values indicating bullish strength and negative values showing bearish pressure.
Key Features
- Trend Confirmation: Validates whether a breakout is genuine or false.
- Comprehensive Inputs: Uses OHLC data, making it more robust than indicators based solely on closing prices.
- Directional Clarity: Positive ASI values suggest upward momentum; negative values highlight downward momentum.
- Breakout Validation: Helps traders confirm whether price has truly broken support or resistance levels.
- Versatility: Can be applied across stocks, commodities, and forex markets.
How It Helps Traders
- Identifying Breakouts: ASI is particularly effective in confirming whether a breakout above resistance or below support is sustainable.
- Spotting Reversals: Sudden shifts in ASI direction can warn traders of potential trend reversals.
- Reducing False Signals: By incorporating multiple price points, ASI filters out noise and avoids misleading signals common in volatile markets.
- Strategic Entry/Exit: Traders can use ASI to time entries when the indicator confirms strength, and exits when momentum weakens.
- Complementary Tool: Works well alongside moving averages, RSI, or MACD to provide a more complete trading strategy.
Conclusion
The Accumulation Swing Index is a powerful tool that combines price action and volatility into a single, easy‑to‑read line. Its ability to confirm breakouts and highlight genuine trend strength makes it invaluable for traders seeking reliability in their analysis. While ASI should not be used in isolation, pairing it with other indicators enhances decision‑making and reduces risk. For traders who want deeper insight into market dynamics and fewer false signals, ASI offers a balanced, time‑tested approach to technical analysis.