

The Bearish Counterattack candlestick formation is a rare but impactful two‑candle setup that often appears at the peak of an uptrend. It represents a direct challenge by sellers against prior bullish momentum, signaling that market sentiment may be shifting from optimism to caution. While uncommon, its precise structure makes it a valuable reversal indicator when confirmed by other signals.
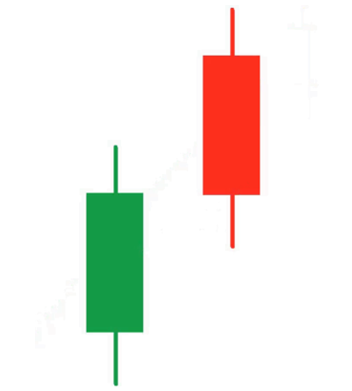
Formation Sequence
- First Candle – Buyer Strength: A long bullish candle continues the prevailing rally, reflecting strong upward momentum.
- Second Candle – Seller Pushback: A long bearish candle opens higher, showing initial optimism, but closes exactly at the same level as the first candle’s close. This precise alignment is the defining trait of the Bearish Counterattack and highlights seller determination.
Distinctive Features
- Typically forms after an extended rally, often near resistance levels.
- The equal closing price between the two candles is the hallmark of the setup.
- Demonstrates firm seller conviction after initial buyer enthusiasm.
- Reliability increases when the second candle is supported by high trading volume.
Sentiment Dynamics
- Initial Phase: Buyers dominate, driving prices higher with confidence.
- Counterattack Phase: Sellers step in aggressively, pushing prices back down to match the prior close.
- Interpretation: The equal closing level reflects a direct confrontation between buyers and sellers, signaling that bullish control has weakened and bearish sentiment is emerging.
Cautions & Constraints
- The Bearish Counterattack is rare due to its precise closing alignment requirement.
- Without confirmation, it may represent only short‑term weakness rather than a sustained reversal.
- Should be combined with other indicators such as RSI, MACD, moving averages, or volume analysis for stronger reliability.
Closing Insights
The Bearish Counterattack is a rare but powerful reversal signal that underscores seller resilience in the face of strong buying pressure. Its unique structure makes it a valuable addition to a trader’s toolkit, especially when confirmed by volume and supporting indicators. Recognizing this pattern at the top of an uptrend can help traders anticipate downturns, protect profits, and position themselves effectively for potential declines.
