
Bullish Belt Hold
The Bullish Belt Hold is a single long bullish candle that opens with a gap down and closes near its high. It reflects strong buying pressure that overwhelms sellers, marking the potential start of a new uptrend.
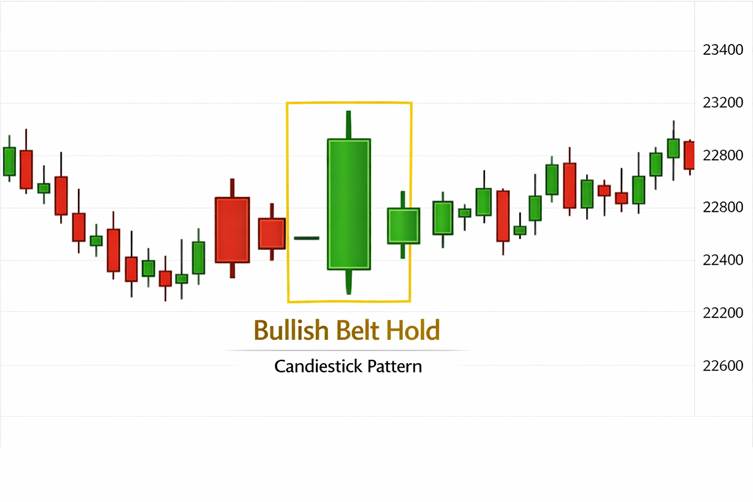
Candle Structure Breakdown
- Prior Trend: Must occur after a clear bearish decline.
- Candlestick:
- Opens with a gap down.
- Closes near or at the session’s high.
- Has little to no upper shadow.
- Appearance: A long bullish candle dominating the chart.
Key Traits to Recognize
- Appears at the bottom of a downtrend.
- Signals a sudden shift in sentiment from sellers to buyers.
- Stronger when accompanied by high trading volume.
- Often traps late sellers who entered after the gap down.
Market Psychology Behind the Pattern
- Before the Pattern: Sellers dominate, pushing prices lower.
- During the Pattern: The market gaps down, encouraging more selling.
- End of Session: Buyers step in aggressively, driving prices up to close near the high.
- Interpretation: A false breakdown traps sellers, and buyers seize control, starting a new bullish trend.
Limitations to Keep in Mind
- The pattern is rare in highly volatile markets where gaps are less common.
- Without confirmation, it may represent only short-term recovery.
- Should be combined with other indicators (RSI, MACD, moving averages) for stronger signals.
Final Thoughts
The Bullish Belt Hold candlestick pattern is a powerful bullish reversal signal, especially when spotted at the bottom of a downtrend. Its sudden shift in sentiment makes it a valuable tool for traders looking to anticipate recoveries and position themselves early for emerging rallies.