
Homing Pigeon Pattern
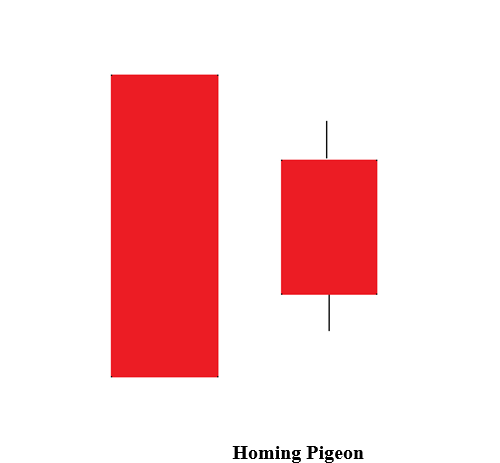
The Homing Pigeon is a two-candle formation where the second bearish candle is contained within the body of the first bearish candle. It resembles the Bullish Harami, but both candles are bearish. Despite the red candles, the pattern suggests weakening selling pressure and a possible reversal upward.
Candle Formation Breakdown
- First Candle: A long bearish (red/black) candle continuing the downtrend.
- Second Candle: Another bearish candle that opens and closes within the body of the first candle.
Key Traits to Recognize
- Appears after a prolonged decline.
- Both candles are bearish, but the second is smaller and contained.
- Signals loss of momentum among sellers.
- Stronger when confirmed by subsequent bullish candles or volume spikes.
Market Psychology Behind the Pattern
- Sellers dominate initially (first candle).
- The second candle shows reduced selling strength, as it fails to break lower.
- Buyers interpret this as a sign of exhaustion among sellers.
- The pattern hints at a potential bullish reversal despite both candles being bearish.
Limitations to Keep in Mind
- Without confirmation, the Homing Pigeon may represent only short-term consolidation.
- It is less reliable in sideways markets.
- Should be combined with other indicators (RSI, MACD, moving averages) for stronger signals.
Final Thoughts
The Homing Pigeon candlestick pattern is a subtle but meaningful bullish reversal signal. Recognizing it at the bottom of a downtrend can help traders anticipate recoveries and position themselves early for potential rallies.