
What Is the Long-Legged Doji?
The Long-Legged Doji is a single candlestick pattern where the open and close prices are nearly identical, but the candle has very long upper and lower shadows. This shows that prices fluctuated widely during the session, yet neither buyers nor sellers could secure control.
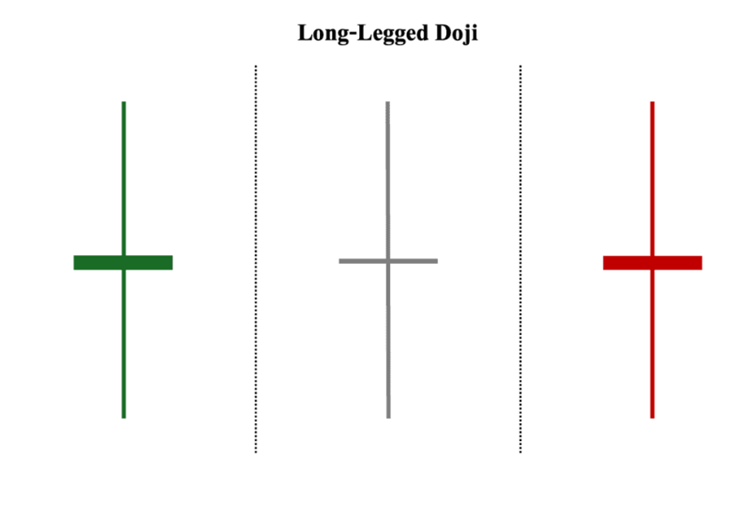
Candle Structure Breakdown
- Body: Extremely small or nonexistent (open ≈ close).
- Shadows: Very long upper and lower wicks, showing large intraday volatility.
- Appearance: Resembles a cross or plus sign with extended vertical lines.
Key Traits to Recognize
- Appears in both uptrends and downtrends.
- Indicates indecision and hesitation among traders.
- Stronger when appearing near support or resistance zones.
- Often precedes a breakout or reversal.
Market Psychology Behind the Pattern
- Buyers push prices higher, but sellers drag them back down.
- Sellers push prices lower, but buyers recover.
- The open and close being nearly equal shows no decisive victory.
- Interpretation: Market participants are uncertain, waiting for confirmation.
Limitations to Keep in Mind
- The Long-Legged Doji alone does not predict direction.
- False signals are common without confirmation.
- Should be combined with other indicators (RSI, MACD, moving averages, or volume analysis).
Final Thoughts
The Long-Legged Doji candlestick pattern is a clear sign of market indecision. While it doesn’t provide directional certainty, recognizing it helps traders anticipate potential breakouts or reversals when combined with other signals.