
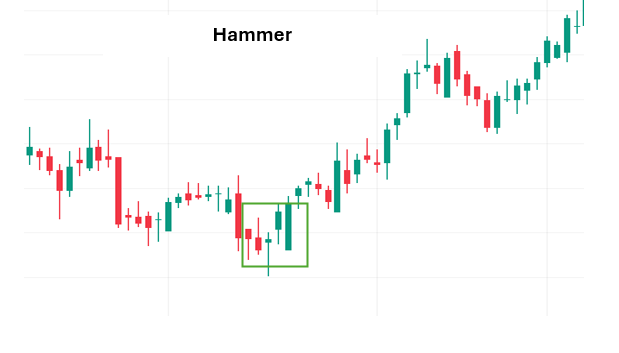
The Hammer is a single-candle formation that signals a possible end to a bearish phase. It shows that although sellers pushed prices lower during the session, buyers regained control and drove the price back up before closing.
Candle Structure Breakdown
The Hammer’s unique structure makes it easy to identify:
- Shape: A small real body positioned near the top of the candle’s range, accompanied by a long lower shadow that is at least twice the length of the body.
- Upper Shadow: Very short or completely absent, reinforcing the idea that buyers closed the session near the high.
- Color: The body can be green (bullish) or red (neutral). While both are valid, a green body adds conviction to the reversal signal.
Visually, the candle resembles a hammer — the long lower wick acts as the handle, while the small body forms the head. This imagery reflects the market’s attempt to “hammer out” a bottom.
Key Identification Points
To correctly interpret the Hammer, traders look for these conditions:
- Appears after a downtrend or prolonged selling pressure.
- The long lower shadow demonstrates rejection of lower prices, showing that buyers stepped in aggressively.
- The signal is stronger when confirmed by high trading volume or a bullish candle in the following session.
Market Psychology
The Hammer represents a dramatic shift in sentiment within a single trading period:
- Sellers initially dominate, driving prices sharply lower.
- Buyers then enter the market, pushing prices back up toward the opening level.
- This tug-of-war reflects a loss of bearish momentum and the emergence of renewed buying interest.
In essence, the Hammer tells traders that although bears tried to push the market down, bulls fought back and prevented a deeper decline.
Limitations to Consider
While powerful, the Hammer is not foolproof:
- A single Hammer does not guarantee reversal — confirmation is essential.
- It performs best in liquid markets with strong participation, where price action is more reliable.
- For higher accuracy, traders should combine it with other indicators such as RSI (Relative Strength Index), MACD (Moving Average Convergence Divergence), or volume analysis.
Final Thoughts
The Hammer candlestick pattern is a simple yet highly effective signal of potential bullish reversal. By recognizing it near support levels, traders can anticipate market turnarounds and position themselves for early entry into emerging uptrends. However, like all technical tools, it should not be used in isolation. When combined with confirmation signals and other technical indicators, the Hammer becomes a valuable ally in identifying profitable trading opportunities.