
What Is the Bullish Long Line?
The Bullish Long Line is a long bullish candle with a large body and minimal shadows. It shows that buyers controlled the market throughout the session, pushing prices steadily upward.
Candle Structure Breakdown
- Open Price: Near the session’s low.
- Close Price: Near the session’s high.
- Body: Very long, showing strong upward momentum.
- Shadows: Minimal or absent, indicating little opposition from sellers.
Key Traits to Recognize
- Appears in both uptrends and downtrends.
- In an uptrend → signals continuation of bullish momentum.
- In a downtrend → signals potential reversal if confirmed by subsequent candles.
- Stronger when accompanied by high trading volume.
Market Psychology Behind the Pattern
- Buyers dominate from the start, pushing prices higher.
- Sellers fail to resist, leaving little or no shadows.
- The long body reflects clear buyer conviction.
- Interpretation: A decisive bullish sentiment and strong momentum.
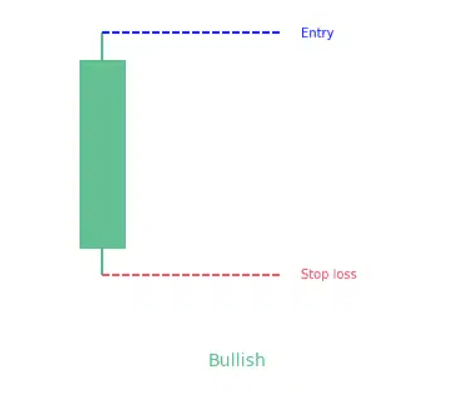
Trading Strategy Considerations
- Entry Point: Long positions are considered after the Bullish Long Line candle closes.
- Stop-Loss Placement: Commonly set below the candle’s low.
- Targets: Nearest resistance levels or a risk-reward ratio (e.g., 2:1).
- Best Context: Works best in trending bullish markets or after breakout confirmations.
Limitations to Keep in Mind
- The Bullish Long Line alone does not guarantee continuation.
- False signals are possible without confirmation.
- Should be combined with other indicators (RSI, MACD, moving averages, or volume analysis).
Final Thoughts
The Bullish Long Line candlestick pattern is a clear sign of buyer dominance and strong upward momentum. Recognizing it in the right context can help traders anticipate continued rallies and position themselves effectively.