
Takuri Pattern
The Takuri is a single-candle bullish reversal pattern. It resembles a hammer but is characterized by an exceptionally long lower shadow, showing that sellers pushed prices down aggressively before buyers regained control.
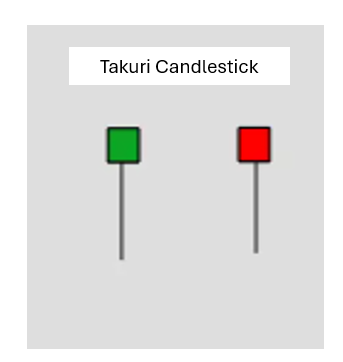
Candle Formation Breakdown
- Body: Small, located near the top of the candle’s range.
- Lower Shadow: Very long, often three times the length of the body.
- Upper Shadow: Minimal or nonexistent.
- Context: Appears after a downtrend, signaling exhaustion among sellers.
Key Traits to Recognize
- Appears at the bottom of a decline.
- Long lower shadow shows strong selling pressure.
- Small body near the top signals buyers regained control.
- Stronger when followed by a bullish confirmation candle.
Market Psychology Behind the Pattern
- Sellers dominate early, driving prices sharply lower.
- Buyers step in aggressively, pulling prices back up.
- The long lower shadow reflects the failed attempt of sellers to maintain control.
- Interpretation: A potential bottoming signal where buyers are ready to reverse the trend.
Limitations to Keep in Mind
- The Takuri is rare due to its precise shadow-to-body ratio.
- Without confirmation, it may represent only short-term volatility.
- Should be combined with other indicators (RSI, MACD, moving averages) for stronger signals.
Final Thoughts
The Takuri candlestick pattern is a powerful bullish reversal signal, marked by its distinctive long lower shadow. Recognizing it at the bottom of a downtrend helps traders anticipate recoveries and adjust their strategies effectively.