
Definition
The Bearish Engulfing pattern is a two-candle reversal formation that appears at the top of an uptrend. It occurs when a large bearish candle completely engulfs the body of the preceding bullish candle, signalling that sellers have decisively taken control of the market. This pattern reflects a sudden shift in sentiment — from buying enthusiasm to selling pressure and often serves as an early warning of a potential trend reversal.
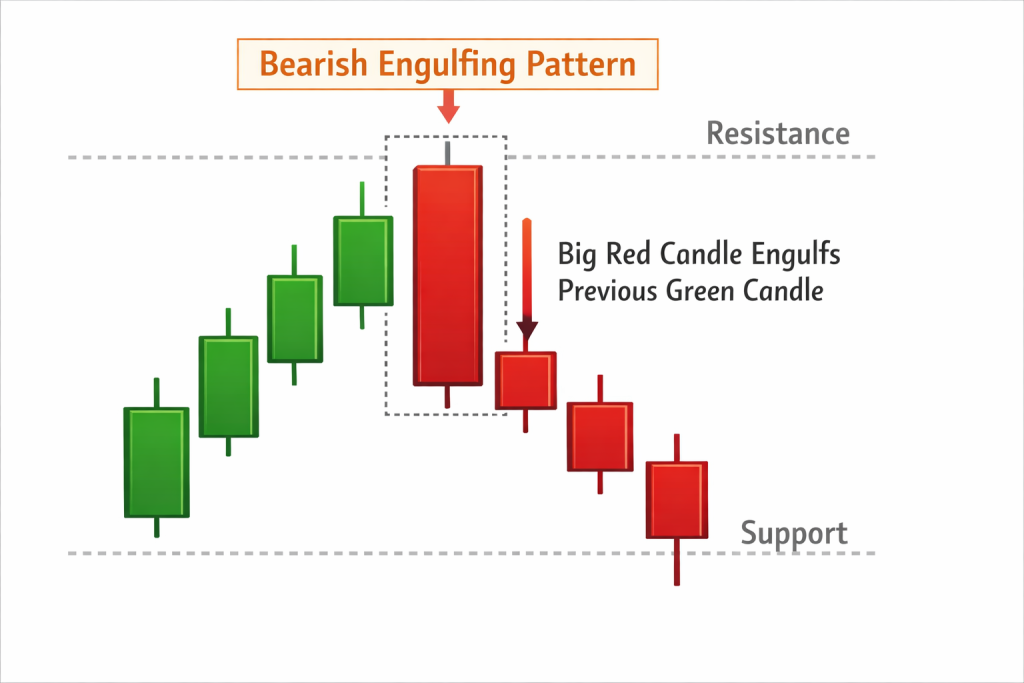
Structure of the Pattern
- First Candle – Bullish Continuation:
A small bullish (green or white) candle forms as part of the ongoing uptrend, showing that buyers are still pushing prices upward. - Second Candle – Bearish Reversal:
A large bearish (red or black) candle opens higher than the previous close but closes significantly lower, completely engulfing the body of the first candle.
This engulfing action visually represents a complete takeover by sellers, erasing the prior session’s gains and establishing downward momentum.
Key Characteristics
- Appears after a prolonged uptrend or strong bullish rally.
- The second candle’s body is noticeably larger and fully covers the first candle’s body.
- The reversal signal is stronger when accompanied by high trading volume, confirming that institutional or large-scale selling is driving the move.
- Works best when it forms near resistance zones, where buying pressure typically weakens.
Market Psychology
- The first candle reflects continued optimism — buyers still dominate, pushing prices higher.
- The second candle begins with confidence, opening higher, but quickly reverses as sellers flood the market.
- This abrupt shift demonstrates a loss of bullish momentum and the emergence of bearish sentiment.
- The engulfing candle’s size and close below the prior candle’s low confirm that sellers have seized control, often triggering follow-up selling in subsequent sessions.
Limitations
- Not every Bearish Engulfing pattern leads to a major reversal; sometimes it signals only a short-term correction.
- It performs best in liquid markets with clear, sustained trends.
- False signals may occur in sideways or choppy markets, so traders should combine it with other indicators such as RSI, MACD, or moving averages for confirmation.
Conclusion
The Bearish Engulfing candlestick pattern is a straightforward yet powerful visual cue of trend reversal. When identified correctly, especially near resistance zones and supported by volume, it helps traders anticipate potential downturns and adjust their strategies accordingly.
By integrating this pattern into a broader technical framework, traders can enhance their timing, improve risk management, and gain deeper insight into market sentiment shifts.