
Introduction
Technical Analysis RVI refers to the Relative Volatility Index with interpolation enhancements. The indicator measures market volatility direction rather than pure price momentum. Developed as a variation of the Relative Strength Index RSI, the RVI focuses on standard deviation and volatility changes instead of price gains and losses.
The main purpose of RVI is to determine whether volatility favors bullish or bearish market conditions. In financial markets, volatility often expands before strong price moves occur. Therefore, monitoring volatility trends can provide traders with early warnings of possible breakouts or reversals.
RVI improves the traditional RVI by applying smoothing and interpolation techniques to reduce noisy movements and create more stable signals. This enhancement helps traders interpret volatility trends more effectively.
Structure
The RVI calculation replaces price momentum with volatility calculations:
RVI = 100 *{Upward Volatility}{Total Volatility}
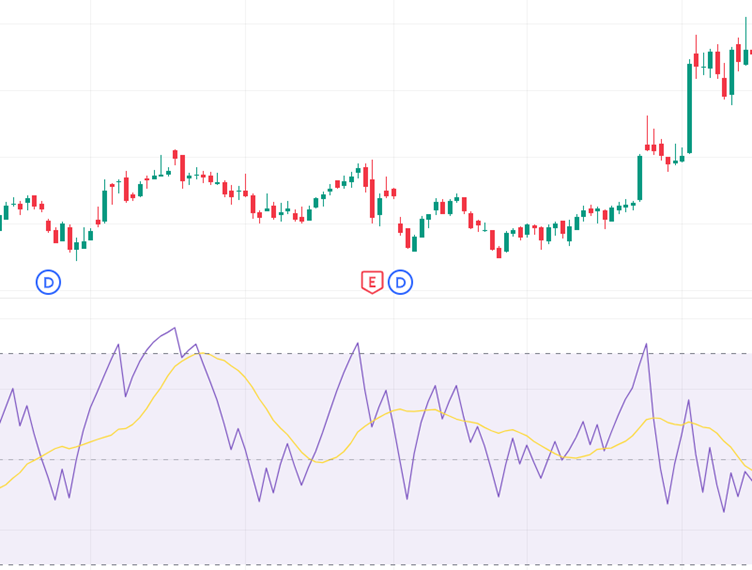
Values typically oscillate between 0 and 100:
- Above 50 indicates bullish volatility dominance.
- Below 50 indicates bearish volatility dominance.
Interpolation smoothing helps reduce sudden spikes caused by short-term volatility bursts.
Features
1. Volatility Trend Analysis
Measures the direction of volatility rather than price alone.
2. Early Breakout Detection
Increasing volatility often precedes strong trends.
3. Reduced False Signals
Interpolation improves signal stability.
4. Trend Confirmation
Bullish volatility supports upward trends.
5. Oscillator-Based Readings
Easy interpretation using threshold levels.
6. Cross-Market Application
Useful in forex, equities, futures, and crypto.
How It Helps Traders
RVI helps traders understand whether market volatility supports bullish or bearish movement. Since major trends are often accompanied by expanding volatility, the indicator becomes useful in identifying breakout opportunities early.
Traders frequently combine RVI with trend-following indicators. For example, if price breaks resistance and RVI rises above 50, it suggests volatility supports the breakout.
Scalpers and day traders use RVI to monitor intraday volatility surges, while swing traders rely on it to confirm trend continuation. The interpolation enhancement ensures traders are not misled by temporary volatility spikes.
Another advantage is emotional control. Volatile markets can create fear and uncertainty, but RVI provides a structured framework for analyzing whether volatility is constructive or destructive.
Conclusion
RVI is a valuable technical indicator for analyzing volatility direction and trend strength. By focusing on volatility behavior rather than only price movement, it provides traders with deeper market insight. The interpolation improvements create smoother and more dependable signals, helping traders avoid false market reactions. When integrated into a disciplined trading strategy, RVI can significantly improve breakout confirmation and volatility analysis.