

Introduction
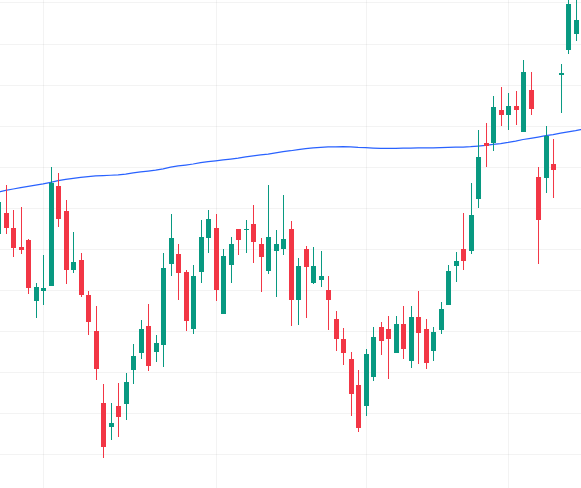
Technical Analysis The 210DMA Crossover is a long-term moving average strategy designed to identify sustained market trends and major reversals. The 210-Day Moving Average covers nearly a full trading year, making it highly respected among institutional traders and long-term investors.
This indicator helps traders understand whether markets remain in healthy long-term uptrends or bearish conditions. Because the 210DMA smooths price data significantly, it removes much of the short-term market noise.
Structure
The formula is: 210DMA =
is simply the average of the last 210 prices.
Broken down into normal calculation steps:
- Add up all 210 prices:
- Divide by 210 (the number of periods):

Signals:
- Bullish crossover above the 210DMA
- Bearish crossover below the 210DMA
Key Features of the Indicator
Strong Trend Filtering
Cuts through market noise to reveal the dominant direction, helping traders and investors stay aligned with major moves.
Reduced Volatility Sensitivity
Designed to be less reactive to short‑term fluctuations, ensuring signals remain reliable even in turbulent conditions.
Long‑Term Investment Guidance
Provides institutional‑grade insights, making it a valuable tool for portfolio managers and long‑horizon investors.
Dynamic Market Structure Analysis
Highlights critical support and resistance zones, offering a deeper understanding of evolving market frameworks.
How It Helps Traders
The 210DMA Crossover helps traders focus on long-term opportunities rather than short-term market noise. Investors often remain bullish while price trades above the 210DMA.It also helps traders avoid bear markets by identifying structural weakness early.
Conclusion
The 210DMA Crossover is a reliable long-term trend-following indicator that provides clarity, stability, and improved investment decision-making. Its ability to filter noise and identify sustained market trends makes it highly effective for long-term traders and institutional investors.
