
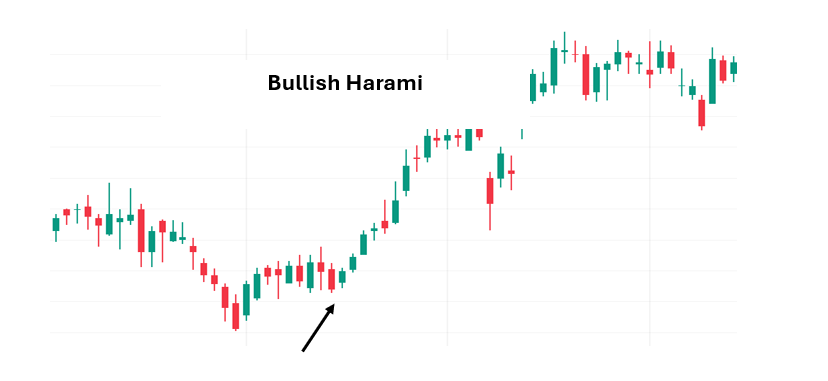
Understanding the Bullish Harami
The Bullish Harami is a two-candle formation where a small bullish candle is contained within the body of the preceding larger bearish candle. The term Harami means “pregnant” in Japanese, symbolizing the smaller candle being “carried” inside the larger one. This imagery reflects the market’s hesitation and the possibility of a shift in sentiment.
Candle Formation Explained
- First Candle: A large bearish (red/black) candle that continues the prevailing downtrend.
- Second Candle: A small bullish (green/white) candle that opens and closes entirely within the range of the first candle’s body.
This containment signals a pause in selling pressure and the potential for buyers to regain control.
Key Features to Identify
- Appears after a prolonged decline or bearish trend.
- The second candle is smaller and fully contained within the first candle’s body.
- The signal is stronger when confirmed by higher trading volume or a bullish candle in subsequent sessions.
Market Sentiment Behind the Pattern
- The first candle reflects strong selling pressure, continuing the downtrend.
- The second candle shows hesitation, as buyers begin to enter and limit further declines.
- This shift suggests a weakening of bearish momentum and the start of accumulation.
In essence, the Bullish Harami represents a market that is “catching its breath,” where sellers are losing dominance and buyers are cautiously stepping in.
Limitations to Consider
- The Bullish Harami is a weaker reversal signal compared to stronger formations like the Bullish Engulfing or Morning Star.
- It may indicate consolidation rather than a full reversal, especially in sideways markets.
- Reliance on the Harami alone can lead to false signals; it should always be paired with volume analysis, trendlines, or momentum indicators.
Conclusion
The Bullish Harami candlestick pattern is a subtle yet important signal of potential reversal. While not as strong as other bullish patterns, it provides traders with an early indication of trend change, especially when confirmed by volume and subsequent price action. By recognizing this formation after a downtrend and combining it with supporting indicators, traders can position themselves strategically for emerging opportunities.
Ultimately, the Bullish Harami reminds us that even small candles can carry significant meaning. It is a quiet but valuable signal that the tide may be turning, offering traders a chance to anticipate market shifts before stronger confirmation patterns appear.