

Introduction
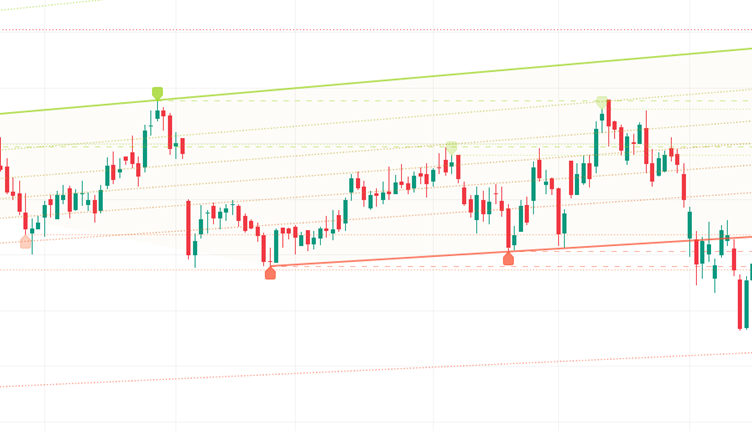
Technical Analysis Support Resistance Trend is a market structure analysis indicator that identifies key support and resistance zones while tracking overall trend direction.
Support and resistance are among the most fundamental concepts in technical analysis.
Structure
The indicator identifies:
- Historical swing highs
- Historical swing lows
- Breakout levels
- Trend direction
Conceptually:
Resistance = Previous Swing High
Support = Previous Swing Low
Features
High Sensitivity Responds quickly to momentum changes, making it ideal for short‑term trading setups.
Overbought & Oversold Signals Rapidly detects reversal zones, helping traders spot potential turning points.
Short‑Term Trading Utility Widely used by scalpers and intraday traders for fast opportunities.
Momentum Acceleration Analysis Measures the speed of RSI changes, offering deeper insight into trend strength.
Interpolation Smoothing Reduces noise and improves readability, ensuring clearer signals.
Fast Signal Generation Captures quick market shifts, allowing traders to act before larger moves unfold.
How It Helps Traders
Support Resistance Trend helps traders identify areas where price may reverse, consolidate, or break out strongly. Traders use these levels for entries, exits, and stop-loss decisions.
Conclusion
Support Resistance Trend is a foundational technical analysis tool that helps traders understand market structure and trend behaviour. Its ability to identify critical price zones makes it essential for professional trading strategies.
