

Introduction
The True Strength Index (TSI) Indicator, developed by William Blau, is a momentum oscillator designed to capture both the direction and strength of price trends. Unlike traditional oscillators such as RSI or Stochastic, TSI applies double smoothing to price changes, which reduces noise and provides a clearer picture of underlying momentum. Traders use TSI to identify overbought/oversold conditions, spot divergences, and confirm trend reversals with greater accuracy.
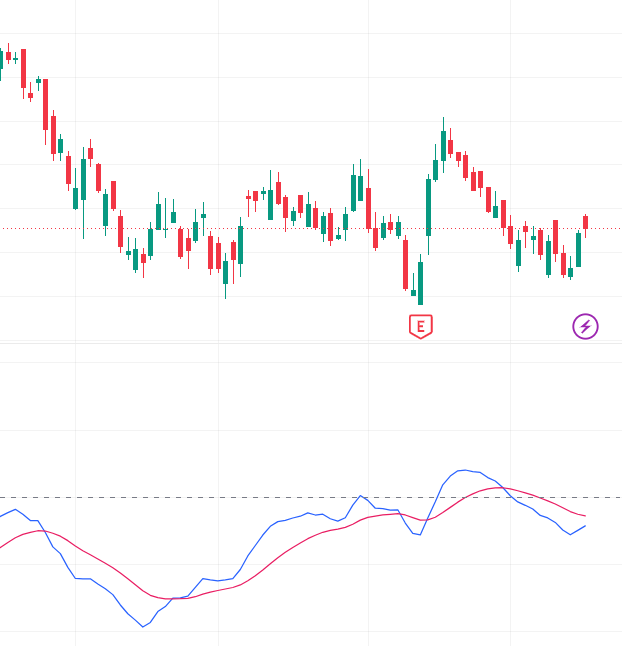
Structure of the TSI Indicator
The TSI is calculated in several steps:
- Price Change → Compute the difference between current and previous closing prices.
- Double Smoothing → Apply two exponential moving averages (EMAs) to the price change and its absolute value.
- Ratio Calculation → Divide the smoothed price change by the smoothed absolute price change.
- Signal Line → A moving average of the TSI line is often added for crossover signals.
The result is an oscillator that fluctuates between +100 and -100, with zero as the midpoint.
Key Features
- Double Smoothing: Reduces short-term noise for clearer signals.
- Bounded Oscillator: Values range between +100 and -100.
- Zero Line Reference: Above zero indicates bullish momentum; below zero indicates bearish momentum.
- Crossover Signals: TSI crossing its signal line generates buy/sell triggers.
- Divergence Detection: Price vs. TSI divergence highlights potential reversals.
How It Helps Traders
- Trend Identification: Confirms whether momentum supports bullish or bearish sentiment.
- Entry & Exit Points: Signal line crossovers provide disciplined trade timing.
- Risk Management: Filters out false signals by smoothing price changes.
- Reversal Detection: Divergences between TSI and price highlight weakening momentum.
- Strategy Integration: Works well with moving averages, MACD, or volume indicators for layered confirmation.
Conclusion
The True Strength Index is a robust momentum oscillator that combines double smoothing with ratio analysis to deliver reliable trading signals. Its ability to filter noise while highlighting trend strength makes it valuable for both short-term and long-term traders. By identifying overbought/oversold conditions, confirming momentum, and spotting divergences, TSI provides a structured framework for disciplined trading. While it should not be used in isolation, combining TSI with trend-following or volatility-based indicators enhances accuracy and confidence. For traders seeking a momentum-driven approach to market analysis, the TSI Indicator offers a dependable tool to navigate bullish and bearish markets effectively.
