

Introduction
The Williams %R Indicator, developed by Larry Williams, is a momentum oscillator that measures overbought and oversold levels in the market. It is similar to the Stochastic Oscillator but inverted, providing values between 0 and -100. This indicator helps traders identify potential reversal points by showing whether prices are trading near recent highs or lows. It is widely used in short-term trading strategies to time entries and exits more effectively.
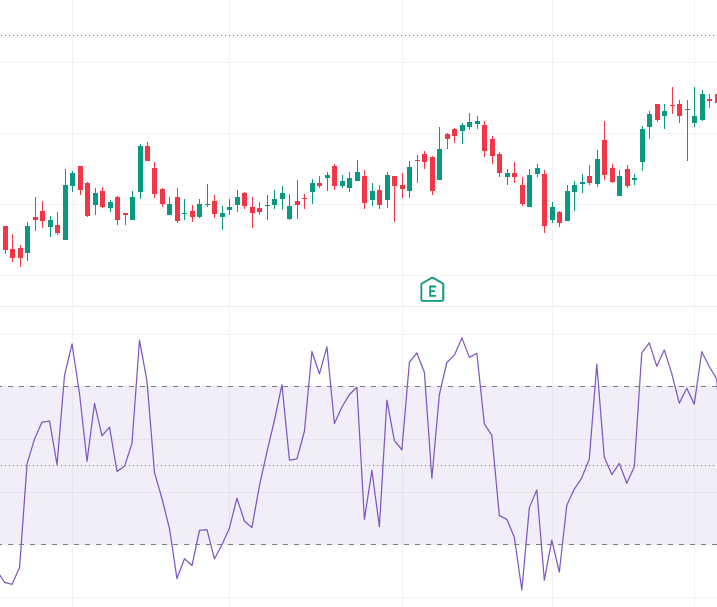
Structure of the Williams %R Indicator
The formula for Williams %R is:
%R=Highest High−CloseHighest High−Lowest Low×−100
Where:
- Highest High → The highest price over the lookback period (commonly 14 days).
- Lowest Low → The lowest price over the same period.
- Close → The most recent closing price.
- Values range between 0 and -100.
- Readings near 0 indicate overbought conditions.
- Readings near -100 indicate oversold conditions.
Key Features
- Bounded Oscillator: Always moves between 0 and -100.
- Overbought/Oversold Zones: Above -20 suggests overbought; below -80 suggests oversold.
- Fast Responsiveness: Reacts quickly to price changes, ideal for short-term trading.
- Divergence Detection: Highlights potential reversals when price and %R move differently.
- Versatility: Works across equities, forex, commodities, and indices.
How It Helps Traders
- Trend Identification: Confirms whether momentum supports bullish or bearish sentiment.
- Entry & Exit Points: Provides disciplined trade timing when price reaches extreme levels.
- Risk Management: Helps avoid chasing trades by highlighting exhaustion zones.
- Reversal Detection: Divergences between price and %R can signal weakening momentum.
- Strategy Integration: Works well with moving averages, MACD, or Bollinger Bands for layered confirmation.
Conclusion
The Williams %R Indicator is a straightforward yet powerful momentum tool that helps traders identify overbought and oversold conditions with precision. Its bounded nature makes interpretation simple, while its responsiveness ensures timely signals for short-term strategies. Although it should not be used in isolation, combining Williams %R with trend-following or volume-based indicators enhances accuracy and confidence. For traders seeking a disciplined, momentum-driven approach to market analysis, the Williams %R Indicator provides a reliable framework to navigate bullish and bearish markets effectively.
