
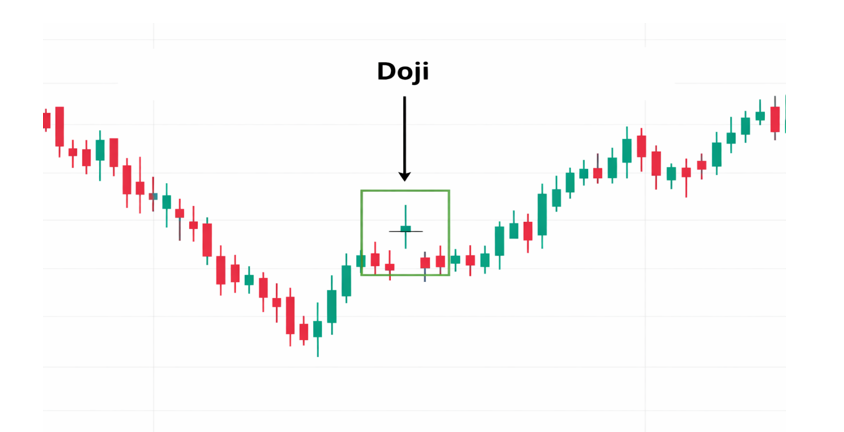
The Doji candlestick pattern is one of the most important formations in technical analysis, widely recognized as a symbol of market indecision. A Doji occurs when the opening and closing prices are nearly equal, leaving a candle with a very small body and noticeable shadows. This unique structure reflects a tug‑of‑war between buyers and sellers, where neither side manages to dominate by the end of the trading session.
Anatomy of the Doji
- Body: Extremely small or nonexistent, showing that the open and close are nearly identical.
- Shadows: Can be long or short, depending on intraday price movement.
- Appearance: Resembles a cross, plus sign, or inverted “T,” making it visually distinctive on a chart.
Types of Doji Patterns
- Standard Doji: Neutral, with balanced upper and lower shadows.
- Long‑Legged Doji: Shows extreme indecision with long wicks on both sides.
- Dragonfly Doji: Features a long lower shadow and no upper shadow, often signaling a potential bullish reversal.
- Gravestone Doji: Displays a long upper shadow and no lower shadow, often signaling a potential bearish reversal.
Market Psychology
The Doji represents a session of uncertainty:
- Buyers push prices higher, sellers push them lower, but the market closes near the opening level.
- This balance reflects hesitation and often signals exhaustion after a strong trend.
- Depending on context, a Doji can precede either a reversal or a continuation.
Limitations to Consider
- Dojis are common and may lack significance in sideways or choppy markets.
- Without confirmation, they may simply reflect short‑term indecision.
- Best used alongside other indicators such as RSI, MACD, support/resistance levels, or volume analysis.
Final Thoughts
The Doji candlestick pattern is a versatile and powerful signal of indecision. While not a standalone trading trigger, it becomes highly meaningful when combined with broader trend context and confirmation signals. Recognizing its variations — Dragonfly, Gravestone, and Long‑Legged — allows traders to anticipate potential turning points and adjust strategies accordingly. For technical analysts, the Doji serves as a reminder that even strong trends can pause, and that market sentiment is always subject to change.