

Introduction
Technical Analysis QStick is a candlestick-based momentum indicator designed to analyze the relationship between opening and closing prices over a selected period. Developed to measure buying and selling pressure, QStick helps traders determine whether bullish or bearish sentiment dominates the market.
The indicator is based on the concept that markets closing above their opening prices demonstrate bullish pressure, while markets closing below their opening prices indicate bearish pressure. Unlike many momentum indicators that rely on complex calculations, QStick focuses directly on candlestick behavior, making it intuitive and easy to interpret.
QStick improves the traditional QStick calculation by incorporating interpolation smoothing techniques. These enhancements reduce erratic fluctuations and provide clearer trend visualization, especially during volatile market conditions.
Because candlestick patterns reflect trader psychology, QStick becomes an effective tool for understanding market sentiment and identifying momentum shifts.
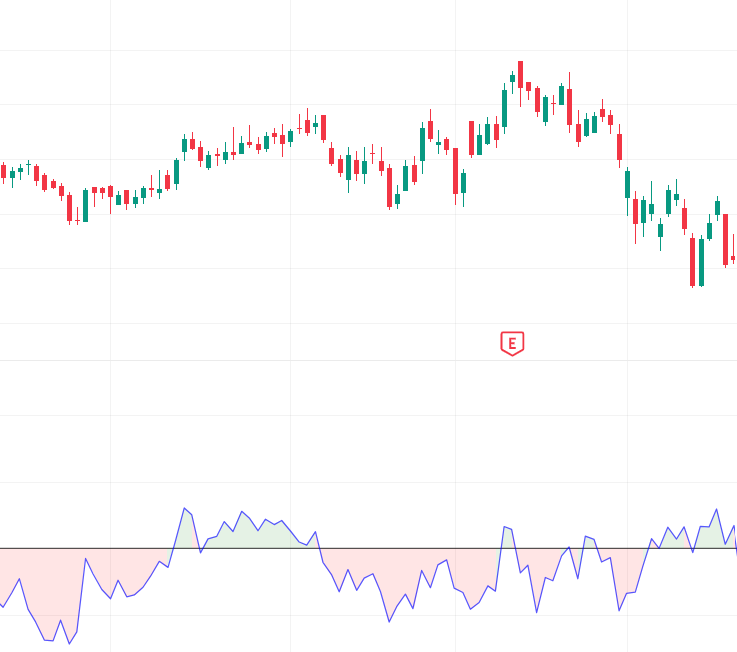
Structure
The QStick formula calculates the moving average of the difference between close and open prices:
QStick = Moving Average(Close – Open)
Interpretation:
- Positive values indicate bullish market sentiment.
- Negative values indicate bearish market sentiment.
Interpolation smoothing improves consistency and readability.
Features
1. Candlestick Sentiment Analysis
Measures bullish and bearish market pressure.
2. Simple Interpretation
Easy-to-understand positive and negative readings.
3. Noise Reduction
Interpolation smooths short-term volatility.
4. Trend Confirmation
Supports price action and trend analysis.
5. Momentum Detection
Identifies strengthening or weakening market sentiment.
6. Multi-Market Application
Works in stocks, forex, commodities, and crypto.
How It Helps Traders
QStick helps traders evaluate market sentiment through candlestick behavior. When the indicator remains positive for an extended period, buyers dominate the market. Negative readings suggest increasing selling pressure.
Swing traders use QStick to confirm breakout strength. For example, if price breaks resistance while QStick rises strongly, bullish momentum is considered more reliable.
Scalpers may use short-term QStick readings to detect rapid sentiment shifts, while long-term traders monitor broader directional trends.
The interpolation enhancement reduces unnecessary noise, allowing traders to focus on meaningful sentiment changes rather than temporary market fluctuations.
QStick also works well alongside other indicators such as moving averages and momentum oscillators. Combining tools improves overall trade confirmation and reduces false entries.
Conclusion
QStick is a practical and effective sentiment indicator that analyzes the relationship between opening and closing prices to measure market pressure. Its smooth signals, simple structure, and momentum insights make it highly useful for traders seeking trend confirmation and sentiment analysis. With interpolation smoothing reducing noise and improving clarity, QStick becomes a valuable addition to modern technical trading systems.
