
Introduction
The Accumulation/Distribution (A/D) Line, created by Marc Chaikin, is a volume-based indicator that measures the flow of money into or out of a security. It combines price and volume data to reveal whether a stock is being accumulated (bought) or distributed (sold). This makes it a valuable tool for confirming trends and spotting divergences.
Structure
The A/D Line is calculated using the Money Flow Multiplier and Money Flow Volume:
- Money Flow Multiplier = ((Close – Low) – (High – Close)) ÷ (High – Low)
- Money Flow Volume = Multiplier × Volume
- A/D Line = Previous A/D + Current Money Flow Volume
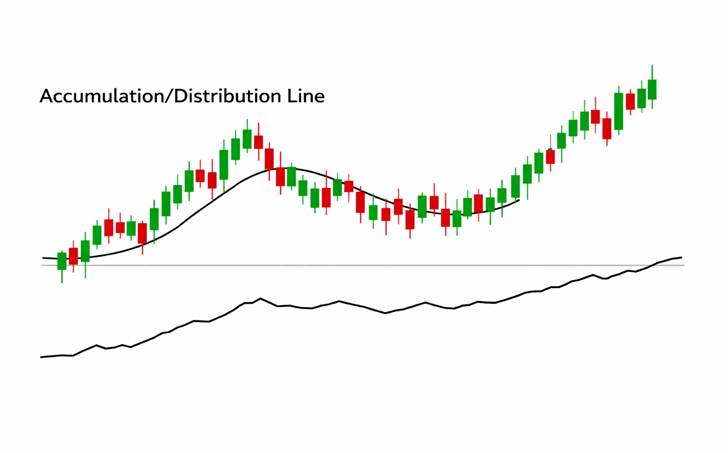
The result is plotted as a cumulative line on the chart.
Features
- Volume Confirmation: Shows whether volume supports price moves.
- Trend Strength: Rising A/D line indicates accumulation; falling line signals distribution.
- Divergence Detection: Price rising but A/D falling suggests weakening momentum.
- Versatility: Works across stocks, ETFs, and indices.
How It Helps Traders
The A/D Line helps traders confirm whether price movements are backed by volume. For example, if a stock breaks out but the A/D Line is flat, the move may lack conviction. Conversely, a rising A/D Line during consolidation suggests hidden buying pressure. Traders use it to validate chart patterns, detect divergences, and anticipate reversals.
Conclusion
The A/D Line bridges the gap between price and volume, offering traders deeper insight into market sentiment. By highlighting accumulation and distribution phases, it helps confirm trends and warn of potential reversals. When combined with other indicators, it becomes a reliable tool for understanding the true strength behind price movements.