
Introduction
The Bollinger Band Strategy is one of the most popular technical analysis tools used by traders to measure volatility and identify potential trading opportunities. Developed by John Bollinger, this strategy uses a moving average with upper and lower bands plotted at a specified number of standard deviations. The bands expand and contract based on market volatility, making them highly effective for spotting overbought, oversold, and breakout conditions.
Structure of the Strategy
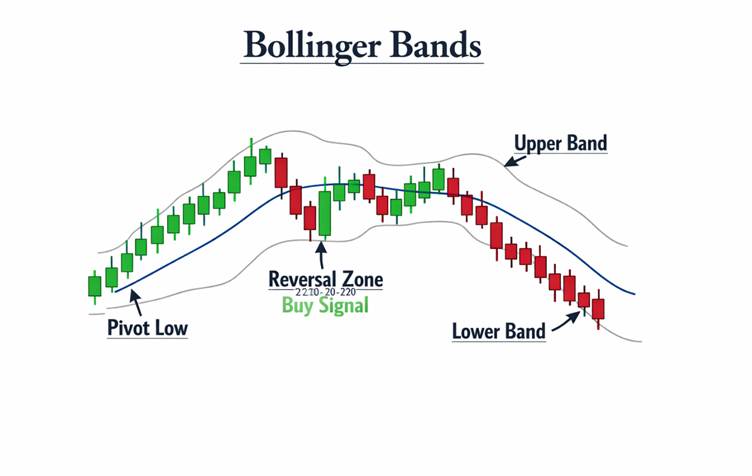
The Bollinger Band Strategy is built around three core components:
- Middle Band: A simple moving average (commonly 20-period SMA).
- Upper Band: Middle band + (standard deviation × multiplier, usually 2).
- Lower Band: Middle band – (standard deviation × multiplier).
- Signals:
- Price touching the upper band suggests overbought conditions.
- Price touching the lower band suggests oversold conditions.
- A band squeeze (narrowing bands) indicates low volatility and a potential breakout.
- A band expansion signals increased volatility and continuation of momentum.
Key Features
- Volatility Awareness: Bands expand and contract with market volatility.
- Overbought/Oversold Signals: Helps traders spot extremes in price action.
- Breakout Potential: Band squeezes often precede sharp moves.
- Trend Confirmation: Price riding the upper band confirms bullish momentum, while hugging the lower band confirms bearish momentum.
- Flexibility: Works across multiple timeframes and asset classes.
How It Helps Traders
- Identifies Market Extremes: Helps traders avoid buying at tops or selling at bottoms.
- Breakout Trading: Band squeezes highlight consolidation zones before explosive moves.
- Trend Participation: Riding the bands allows traders to stay in strong trends longer.
- Risk Management: Provides clear zones for stop-loss placement.
- Versatility: Effective for scalping, swing trading, and long-term strategies.
Conclusion
The Bollinger Band Strategy is a versatile and powerful tool that combines volatility measurement with trend analysis. By tracking price relative to the bands, traders gain insights into overbought and oversold conditions, breakout potential, and trend strength. While false signals can occur in sideways markets, pairing Bollinger Bands with momentum indicators like RSI or MACD enhances reliability. Its adaptability across timeframes and asset classes makes it suitable for traders at all levels. For those seeking a structured, rule-based approach to volatility and trend trading, the Bollinger Band Strategy provides a clear framework for disciplined decision-making and profitable opportunities.