
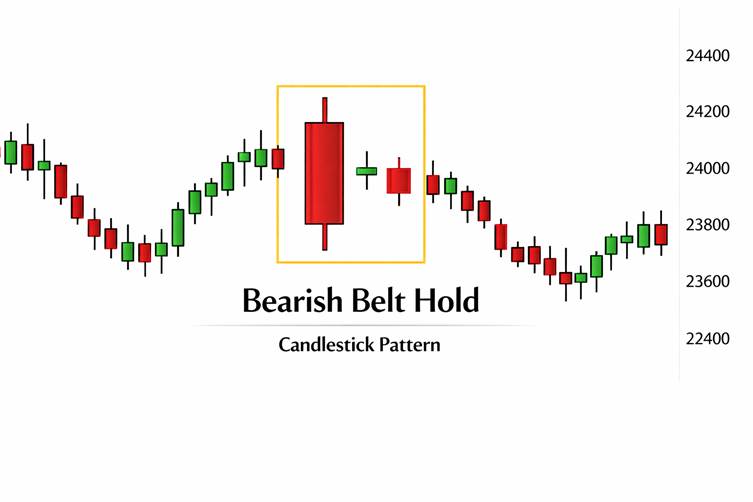
The Bearish Belt Hold is a reversal candlestick pattern that signals the end of a bullish trend and the start of bearish momentum. It often catches traders off guard because it opens strongly (gap up) but closes near its low, showing sellers have taken control.
Structure Breakdown
- Prior Trend: Must occur after a clear bullish rally.
- Candlestick:
- Opens with a gap up.
- Closes near or at the session’s low.
- Has little to no lower shadow.
- Appearance: A long bearish candle dominating the chart.
Key Traits to Recognize
- Appears at the top of an uptrend.
- Signals a sudden shift in sentiment from buyers to sellers.
- Stronger when accompanied by high trading volume.
- Sometimes preceded by 2–3 smaller bullish candles, making the reversal more pronounced.
Market Psychology
- Before the Pattern: Buyers are confident, pushing prices higher.
- During the Pattern: The market gaps up, attracting late buyers.
- End of Session: Sellers overwhelm buyers, driving prices down to close near the low.
- Interpretation: A false breakout traps late buyers, and sellers seize control, starting a new bearish trend.
Limitations
- The pattern is rare in highly volatile markets (like major currency pairs) because gaps are less common.
- Without confirmation, it may represent only short-term consolidation.
- Best used alongside indicators like RSI, MACD, or moving averages for stronger signals.
Final Thoughts
The Bearish Belt Hold candlestick pattern is a powerful bearish reversal signal, especially when spotted at the top of an uptrend. Its sudden shift in sentiment makes it a valuable tool for traders looking to anticipate downturns and position themselves early.