
Bearish Harami Cross
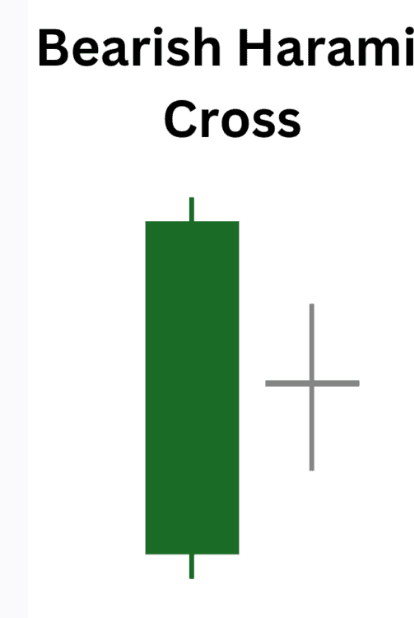
The Bearish Harami Cross is a variation of the Bearish Harami pattern. It consists of a large bullish candle followed by a Doji candle (open and close nearly equal) that is contained within the body of the first candle. The Doji reflects indecision, weakening the prior bullish momentum.
Candle Formation Breakdown
- First Candle: A long bullish (green/white) candle continuing the uptrend.
- Second Candle: A Doji candle that opens and closes within the body of the first candle.
Key Traits to Recognize
- Appears after a prolonged rally.
- The Doji signals indecision and loss of bullish strength.
- Stronger when confirmed by subsequent bearish candles.
- Often appears near resistance zones.
Market Psychology Behind the Pattern
- Buyers dominate initially, pushing prices higher (first candle).
- The Doji shows hesitation, as neither buyers nor sellers gain control.
- Traders interpret this as a warning of potential reversal.
- Sellers often step in after confirmation, driving prices lower.
Limitations to Keep in Mind
- The Bearish Harami Cross alone does not guarantee reversal.
- False signals are possible without confirmation.
- Should be combined with other indicators (RSI, MACD, moving averages, or volume analysis).
Final Thoughts
The Bearish Harami Cross candlestick pattern is a subtle but powerful reversal signal. Recognizing it at the top of an uptrend can help traders anticipate downturns and adjust their strategies with caution.