
Down Gap Side-by-Side White Lines Pattern
The Down Gap Side-by-Side White Lines is a two-candle bearish continuation pattern. It occurs when two bullish candles appear after a downward gap,but fail to reverse the trend.
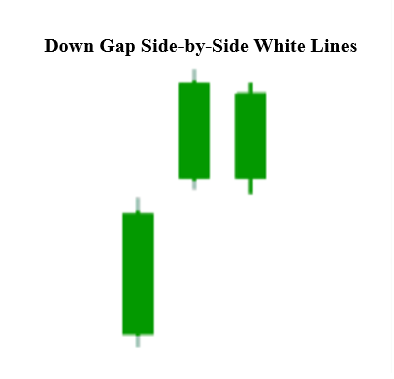
Candle Formation Breakdown
- First Candle: A bullish (white/green) candle that opens with a downward gap relative to the prior session.
- Second Candle: Another bullish candle that opens near the first candle’s open and closes at a similar level, forming “side-by-side” white lines.
Key Traits to Recognize
- Appears during a downtrend.
- Both candles are bullish, but they form after a downward gap.
- The closes are nearly equal, creating a “side-by-side” appearance.
- Despite bullish color, the pattern signals bearish continuation.
Market Psychology Behind the Pattern
- Sellers dominate the trend, creating a downward gap.
- Buyers attempt recovery with two bullish candles.
- The side-by-side closes show lack of momentum — buyers cannot push higher.
- Sellers interpret this as weakness, and the downtrend resumes.
Limitations to Keep in Mind
- The Down Gap Side-by-Side White Lines is rare due to its precise gap and alignment requirements.
- Without confirmation, it may represent only short-term consolidation.
- Should be combined with other indicators (RSI, MACD, moving averages) for stronger signals.
Final Thoughts
The Down Gap Side-by-Side White Lines candlestick pattern is a deceptive setup: although both candles are bullish, the context of the downward gap makes it a bearish continuation signal. Recognizing it helps traders avoid false optimism and stay aligned with the dominant market direction.