
Introduction
The EMA Crossover Indicator is one of the most widely used tools in technical analysis. It is based on the Exponential Moving Average (EMA), which gives more weight to recent price data compared to the Simple Moving Average (SMA). The crossover strategy involves plotting two EMAs of different periods (commonly short-term and long-term) and observing when they intersect. These intersections signal potential changes in trend direction, making EMA crossovers a favourite among traders for spotting entry and exit points.
Structure of the EMA Crossover
The EMA Crossover Indicator typically uses:
- Short-Term EMA: Faster-moving average (e.g., 9-day or 12-day EMA).
- Long-Term EMA: Slower-moving average (e.g., 26-day EMA).
- Crossover Signals:
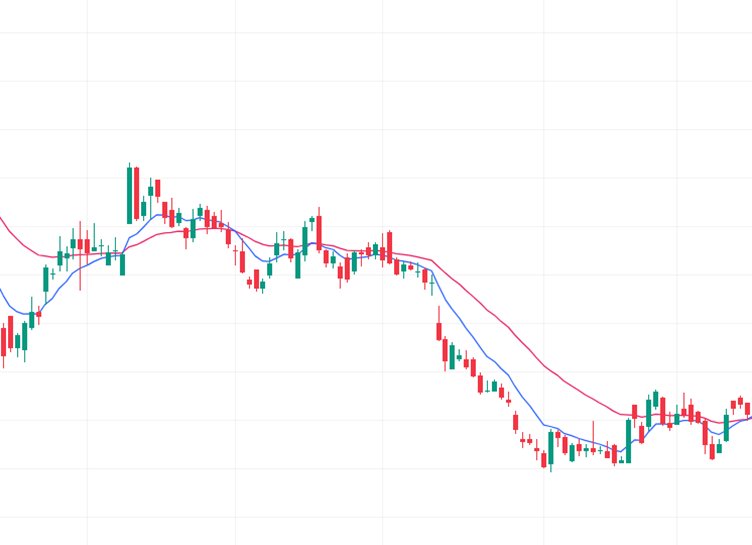
- Bullish Signal: Short-term EMA crosses above the long-term EMA → potential upward trend.
- Bearish Signal: Short-term EMA crosses below the long-term EMA → potential downward trend.
This structure allows traders to visualize momentum shifts and trend reversals clearly.
Key Features
- Trend Identification: Highlights bullish and bearish phases.
- Momentum Sensitivity: Reacts faster to price changes than SMA crossovers.
- Clear Signals: Provides straightforward buy/sell triggers.
- Versatility: Works across multiple timeframes and asset classes.
- Integration Friendly: Often paired with RSI, MACD, or volume indicators for confirmation.
How It Helps Traders
- Entry & Exit Points: Provides clear signals for entering long or short positions.
- Trend Confirmation: Confirms whether momentum supports price direction.
- Risk Management: Helps avoid trades against dominant sentiment.
- Strategy Flexibility: Can be applied to intraday, swing, or long-term trading.
- Portfolio Allocation: Guides traders to allocate capital toward assets showing strong crossover signals.
Conclusion
The EMA Crossover Indicator is a powerful trend-following tool that balances responsiveness with clarity. By giving more weight to recent price data, it reduces lag and provides faster signals compared to SMA crossovers. While it should not be used in isolation, combining EMA crossovers with momentum or volume-based indicators enhances accuracy and confidence. For traders seeking disciplined entry and exit strategies, the EMA Crossover Indicator offers a structured framework to navigate bullish and bearish markets effectively.