
Introduction
The MACD Trend Indicator is a widely used technical analysis tool that builds upon the classic Moving Average Convergence Divergence (MACD). While the standard MACD highlights momentum shifts and potential reversals, the MACD Trend Indicator emphasizes trend direction and strength, making it easier for traders to stay aligned with prevailing market movements. It is particularly useful for swing traders and long-term investors who want to filter out noise and focus on sustained momentum.
Structure of the MACD Trend Indicator
The MACD Trend Indicator is derived from:
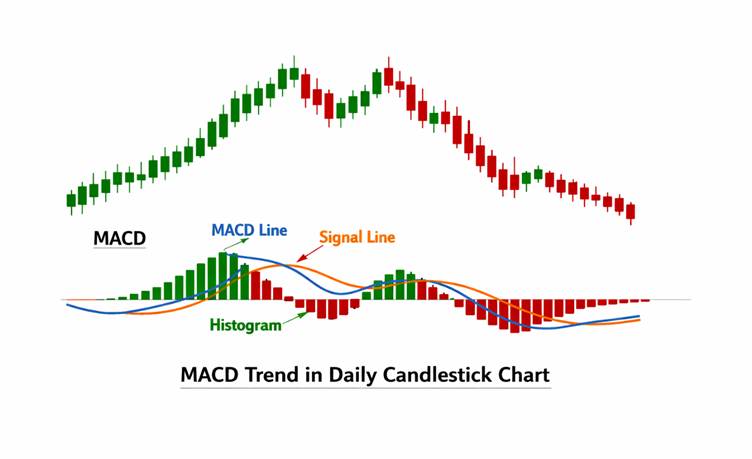
- MACD Line → Difference between the 12-period EMA and 26-period EMA.
- Signal Line → 9-period EMA of the MACD line.
- Histogram → Difference between MACD line and Signal line, showing momentum visually.
- Trend Filter → The indicator emphasizes whether MACD values are consistently above or below zero, signaling bullish or bearish trends.
This structure allows traders to see not just short-term crossovers but also the broader trend direction.
Key Features
- Trend Emphasis: Highlights sustained bullish or bearish phases.
- Momentum Visualization: Histogram shows the strength of ongoing moves.
- Crossover Signals: Buy/sell triggers when MACD crosses the signal line.
- Noise Reduction: Filters out minor fluctuations by focusing on trend alignment.
- Versatility: Works across multiple timeframes and asset classes.
How It Helps Traders
- Trend Identification: Price above zero on MACD suggests bullish momentum; below zero suggests bearish momentum.
- Entry & Exit Points: Crossovers between MACD and Signal line provide disciplined buy/sell signals.
- Risk Management: Reduces false entries by requiring confirmation of trend direction.
- Reversal Detection: Histogram shrinking or flipping signals weakening momentum.
- Strategy Integration: Works well with RSI, Moving Averages, or volume indicators for layered confirmation.
Conclusion
The MACD Trend Indicator is a powerful extension of the classic MACD, designed to highlight both momentum and sustained trend direction. By focusing on whether MACD values remain above or below zero, it helps traders avoid false signals and stay aligned with genuine market moves. While it should not be used in isolation, combining MACD Trend with oscillators or volatility-based tools enhances accuracy and confidence. For traders seeking a disciplined, trend-focused approach to market analysis, the MACD Trend Indicator offers a structured framework to navigate bullish and bearish markets effectively.