
The Linear Regression (LinReg) Indicator is a statistical tool applied to technical analysis that helps traders identify the underlying trend of a security. Unlike simple moving averages, which smooth past data, LinReg uses regression analysis to fit a straight line through price points over a chosen period. This line represents the “best fit” of price action, offering traders a clear view of the prevailing trend direction and strength.
Structure of the LinReg Indicator
The LinReg is built using:
- Price Data: Typically closing prices over a selected timeframe.
- Regression Line: A straight line calculated using least-squares regression, minimizing the distance between actual prices and the fitted line.
- Slope & Intercept:
- Slope → Indicates the rate of price change (trend strength).
- Intercept → Starting point of the regression line.
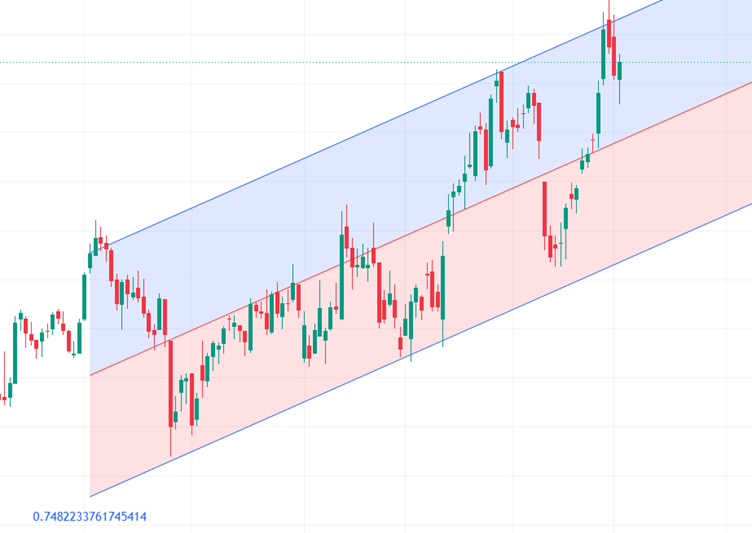
Some versions also include LinReg Channels, which plot parallel lines above and below the regression line to highlight volatility and potential support/resistance zones.
Key Features
- Trend Clarity: Provides a mathematically precise trend line.
- Slope Analysis: Positive slope indicates bullish momentum; negative slope indicates bearish momentum.
- Noise Reduction: Filters out random fluctuations by focusing on overall direction.
- Versatility: Can be applied to any timeframe or asset class.
- Channel Option: Adds volatility bands for breakout or reversal signals.
How It Helps Traders
- Trend Identification: Helps traders quickly determine whether the market is trending up or down.
- Entry & Exit Points: Crossovers between price and the regression line can signal potential buy/sell opportunities.
- Momentum Measurement: The slope of the line quantifies trend strength, aiding in decision-making.
- Risk Management: LinReg channels provide dynamic support/resistance levels for stop-loss placement.
- Strategy Integration: Works well with oscillators like RSI or MACD for confirmation of momentum and reversals.
Conclusion
The Linear Regression Indicator is a powerful statistical tool that brings mathematical precision to trend analysis. By fitting a regression line through price data, it helps traders visualize the true direction and strength of a trend while filtering out noise. Its adaptability across timeframes and asset classes makes it suitable for both short-term and long-term strategies. While LinReg should not be used in isolation, combining it with momentum or volume-based indicators enhances accuracy and confidence. For traders seeking a disciplined, data-driven approach to market analysis, the LinReg Indicator offers a structured framework to navigate bullish and bearish markets effectively.