
Introduction
The Negative Volume Index (NVI) is a volume-based technical analysis tool developed by Paul Dysart and later refined by Norman Fosback. It focuses on days when trading volume decreases compared to the previous day, under the assumption that smart money (institutional investors) tends to act on quieter, low-volume days. By tracking price changes during these periods, NVI helps traders identify underlying market trends and anticipate reversals.
Structure of the NVI Indicator
The NVI is calculated as follows:
- Volume Comparison: Identify days when current volume < previous day’s volume.
- Price Adjustment: On those days, adjust the NVI value based on percentage price change.
[ NVI_t = NVI_{t-1} + {Price_t – Price_{t-1}}{Price_{t-1}}) * NVI_{t-1} ] - No Change on High-Volume Days: If volume increases, NVI remains unchanged.
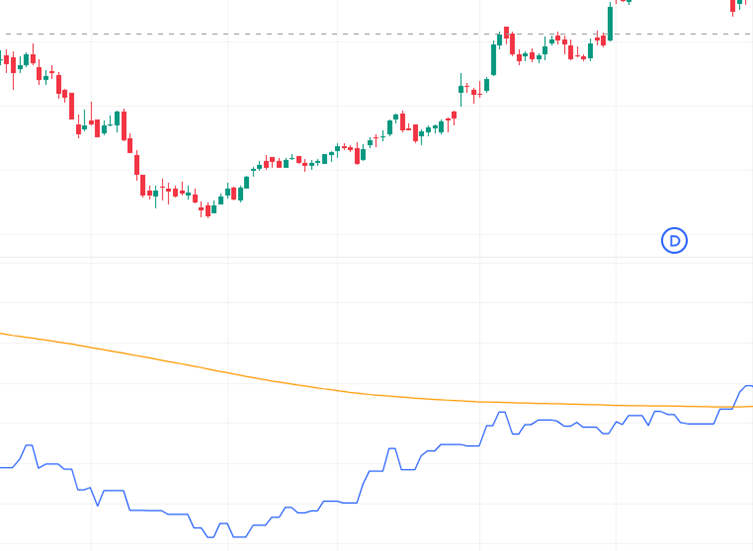
- Signal Line: Often a moving average (e.g., 255-day MA) is plotted alongside NVI to generate crossover signals.
Key Features
- Focus on Low-Volume Days: Highlights price action when volume contracts.
- Smart Money Tracking: Assumes institutional investors act during quieter sessions.
- Trend Confirmation: Positive NVI trend suggests accumulation; negative trend suggests distribution.
- Crossover Signals: NVI crossing above its moving average is bullish; below is bearish.
- Versatility: Works across multiple timeframes and asset classes.
How It Helps Traders
- Trend Identification: Confirms whether institutional investors are supporting bullish or bearish moves.
- Entry & Exit Points: Crossover signals provide disciplined buy/sell opportunities.
- Risk Management: Reduces false signals by focusing on quieter trading days.
- Reversal Detection: Divergence between NVI and price can signal weakening momentum.
- Strategy Integration: Works well with On-Balance Volume (OBV), Moving Averages, or MACD for layered confirmatio
Conclusion
The Negative Volume Index is a unique volume-based indicator that emphasizes price action during low-volume days, offering insights into institutional activity and underlying market trends. Its ability to highlight accumulation or distribution phases makes it valuable for anticipating reversals and confirming momentum. While NVI should not be used in isolation, combining it with trend-following or momentum indicators enhances accuracy and confidence. For traders seeking a disciplined, volume-aware approach to market analysis, the NVI Indicator provides a structured framework to navigate bullish and bearish markets effectively.