
Introduction
The Positive Volume Index (PVI) is a classic volume‑based indicator introduced by Norman Fosback. It focuses on days when trading volume rises compared to the previous session, under the assumption that “the crowd” is most active during high‑volume periods. PVI helps traders understand whether price movements are supported by strong participation.
Structure
The formula updates only when today’s volume exceeds yesterday’s:
[ PVI_t = PVI_{t-1} + {Close_t – Close_{t-1}}{Close_{t-1}}) PVI_{t-1} ]
If volume decreases, PVI remains unchanged. This cumulative calculation produces a line that tracks price changes only on high‑volume days.
Features
- Reacts exclusively to sessions with rising volume.
- Highlights crowd psychology and institutional activity.
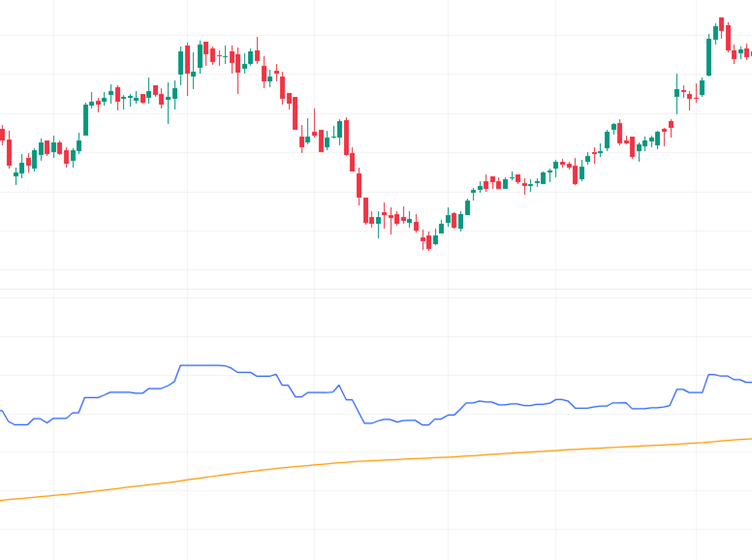
- Often smoothed with moving averages for trend analysis.
- Complements the Negative Volume Index (NVI) for a balanced view.
How it helps traders
PVI is particularly useful for confirming breakouts. If price rallies are accompanied by a rising PVI, it signals strong conviction. Conversely, if price rises but PVI stagnates, traders may suspect weak participation. Long‑term investors often watch for PVI crossing above its moving average as a bullish confirmation.
Conclusion
PVI is a powerful lens into market behavior during high‑volume days. By focusing on crowd participation, it helps traders validate whether rallies or declines are genuine. Combined with NVI, OBV, or RSI, PVI becomes a cornerstone for volume‑based trend confirmation strategies.