
Introduction
The Percentage Volume Oscillator (PVO) is a momentum indicator that applies the logic of moving average convergence/divergence (MACD) to trading volume instead of price. The histogram crossover version highlights shifts in volume momentum, helping traders anticipate changes in market activity before price reacts.
Structure
PVO is calculated as:
[ PVO = {EMA_{short}(Volume) – EMA_{long}(Volume)}{EMA_{long}(Volume)} * 100 ]
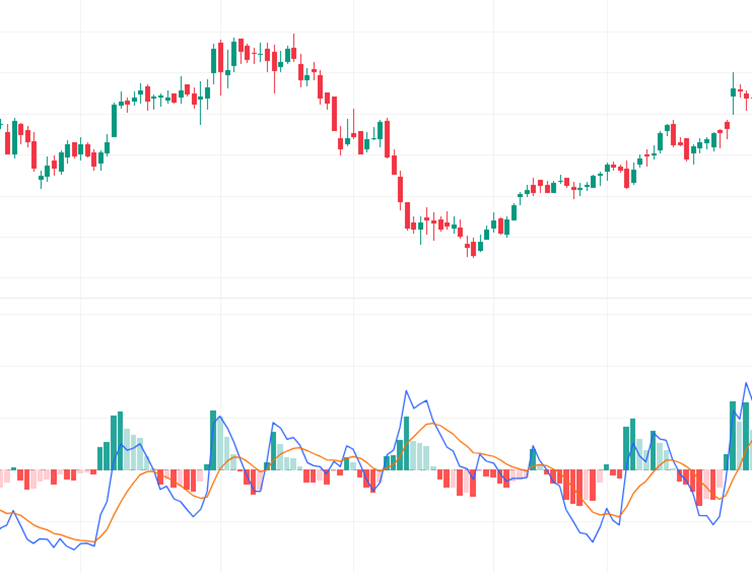
The histogram represents the difference between the PVO line and its signal line (usually a 9‑period EMA of PVO). Crossovers of the histogram above or below zero indicate shifts in volume momentum.
Features
- Normalizes volume changes as percentages.
- Provides a histogram for visual clarity.
- Identifies bullish or bearish volume momentum.
- Works well across multiple timeframes.
How it helps traders
The histogram crossover alerts traders to early shifts in participation. For example, a bullish crossover suggests increasing volume momentum, often preceding price rallies. A bearish crossover warns of declining participation, which may foreshadow reversals. Traders use PVO to confirm breakouts, spot divergences, and gauge the strength of ongoing trends.
Conclusion
PVO Histogram Crossover is a refined tool for monitoring volume dynamics. By translating raw volume into percentage‑based momentum signals, it helps traders anticipate market shifts with greater precision. When paired with price‑based oscillators like MACD or RSI, PVO adds depth to technical analysis, making it a valuable ally in spotting sustainable moves.