
Introduction
Technical Analysis RVGI stands for Relative Vigor Index with interpolation enhancements. It is a momentum-based technical indicator designed to measure the strength of a market trend by comparing the closing price to the trading range over a selected period. The core concept behind RVGI is that during bullish trends, prices tend to close near the high of the trading range, while during bearish trends, prices usually close near the low.
The Relative Vigor Index was developed to provide traders with smoother and more reliable momentum analysis compared to traditional oscillators. Unlike indicators that focus only on price movement, RVGI incorporates both price action and market range behavior, making it more dynamic in evaluating trend strength.
RVGI improves upon the standard RVGI by applying interpolation and smoothing techniques that reduce erratic fluctuations and noise. This creates cleaner signals and improves visual interpretation for traders. The indicator is especially popular among swing traders and trend-following traders who seek confirmation before entering or exiting positions.
Because markets often experience temporary volatility spikes, interpolation helps stabilize the indicator and prevents traders from reacting emotionally to short-term fluctuations. This makes RVGI valuable in forex, stocks, commodities, and cryptocurrency markets.
Structure
The RVGI calculation compares price movement relative to the trading range:
RVGI = {Close – Open}{High – Low}
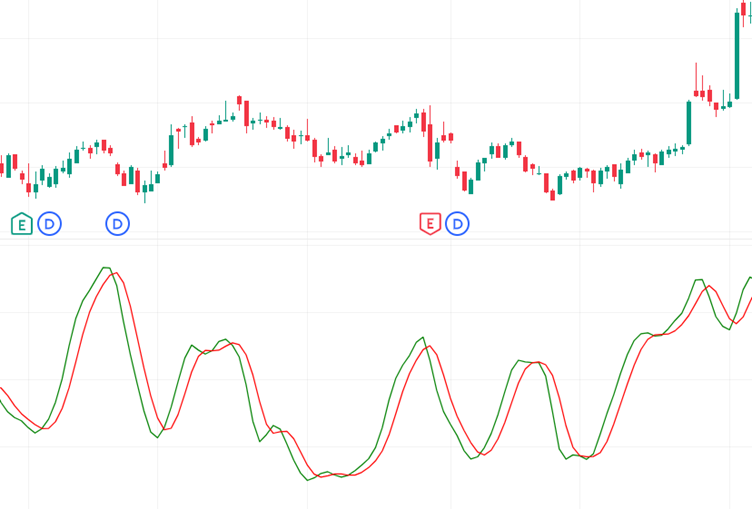
The result is then smoothed using weighted averages and interpolation methods to generate:
- Main RVGI line
- Signal line
When the RVGI line crosses above the signal line:
- Bullish momentum may strengthen.
When it crosses below:
- Bearish momentum may increase.
The interpolation component reduces abrupt movements and improves trend consistency.
Features
1. Trend Strength Measurement
RVGI evaluates the conviction behind price movements.
2. Smooth Signal Generation
Interpolation reduces market noise and false signals.
3. Momentum Confirmation
Confirms whether trends are gaining or losing strength.
4. Crossover Trading Signals
Signal-line crossovers help identify entries and exits.
5. Divergence Detection
Price and RVGI divergence can indicate reversals.
6. Multi-Market Adaptability
Works across stocks, forex, crypto, and commodities.
How It Helps Traders
RVGI helps traders identify the true strength behind market movements. Many indicators react aggressively to short-term price spikes, but RVGI focuses on the relationship between close prices and the trading range, offering deeper insight into market sentiment.
Swing traders often use RVGI crossovers as confirmation before entering trades. If the RVGI crosses above its signal line during an uptrend, it may indicate strengthening bullish momentum. Conversely, bearish crossovers may suggest weakening market conditions.
The indicator also helps traders avoid false breakouts. A price breakout without RVGI confirmation may lack momentum and could fail quickly. Traders therefore use RVGI as a secondary validation tool.
Because interpolation smooths the indicator, traders can focus on meaningful momentum shifts rather than reacting to every small fluctuation. This improves emotional discipline and trading consistency.
Conclusion
RVGI is a sophisticated momentum indicator that combines price behavior and trading range analysis to evaluate trend strength. Its smooth signals, crossover analysis, and momentum confirmation capabilities make it highly effective for modern traders. By filtering noise and improving trend clarity, RVGI helps traders make more informed decisions and reduce unnecessary market reactions. When combined with proper risk management and trend analysis, it becomes a powerful addition to any technical trading strategy.