
Introduction
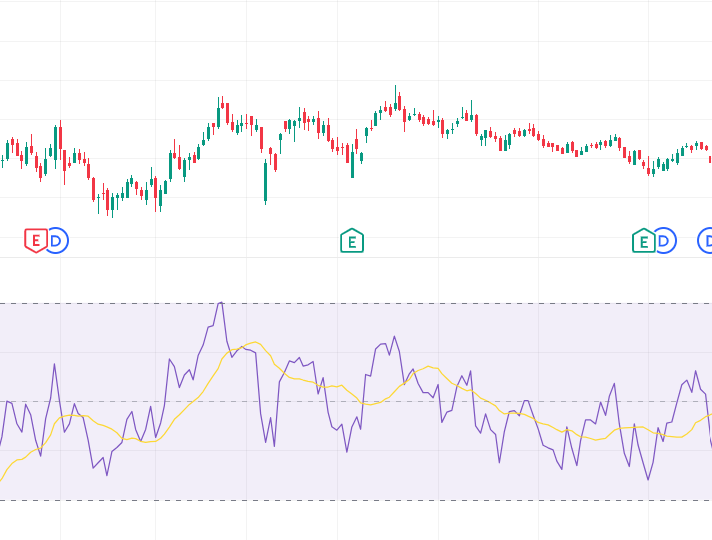
Relative Strength Index RSI is an enhanced version of the widely used Relative Strength Index indicator. Developed by J. Welles Wilder Jr., RSI measures the strength and speed of price movements to determine overbought and oversold market conditions.
RSI is one of the most popular oscillators in trading because it helps traders identify potential reversals and trend momentum simultaneously.
Structure
The RSI formula is:
RSI = 100 – {100}{1 + RS}
Where:
RS = {Average Gain}/ {Average Loss}
The interpolation enhancement smooths movements and reduces false spikes.
Features
1. Overbought and Oversold Detection
Above 70 suggests overbought; below 30 suggests oversold.
2. Divergence Signals
RSI divergence may predict reversals.
3. Trend Strength Analysis
Strong RSI confirms trend continuation.
4. Swing Rejection Patterns
Useful for advanced momentum trading.
5. Noise Reduction
Interpolation improves signal quality.
6. Multi-Timeframe Application
Useful from scalping to investing.
How It Helps Traders
RSI helps traders identify exhaustion zones where price reversals may occur. During strong uptrends, RSI staying above 50 often confirms bullish strength.
Day traders use RSI for short-term reversal entries, while swing traders combine RSI with support and resistance for higher-probability setups.
The indicator also prevents traders from entering trades too late after extreme price moves.
Conclusion
RSI remains one of the most effective momentum indicators in technical analysis. Its ability to identify overbought conditions, oversold zones, and trend momentum makes it essential for traders across all markets. With interpolation smoothing, RSI becomes even more reliable by reducing false signals and improving overall trading accuracy.