
Bearish Stalled Pattern
The Bearish Stalled is a three-candle reversal pattern that appears at the top of an uptrend. It shows that buyers are losing strength, and sellers may soon take control.
Candle Formation Breakdown
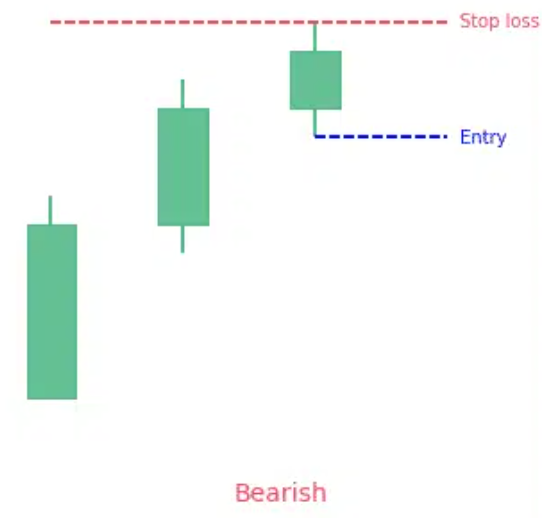
- First Candle: A long bullish candle continuing the uptrend.
- Second Candle: Another bullish candle, but smaller in size, showing reduced upward force.
- Third Candle: A small bullish candle (often a spinning top or doji) that closes near the second candle’s close, signaling hesitation and exhaustion.
Key Traits to Recognize
- Appears after a prolonged rally.
- Each candle shows progressively weaker bullish momentum.
- The third candle reflects indecision or stalling.
- Stronger when followed by a bearish confirmation candle.
Market Psychology Behind the Pattern
- Buyers dominate initially, pushing prices higher.
- Momentum slows as fewer buyers step in.
- The final candle shows hesitation, suggesting exhaustion.
- Sellers interpret this as a signal to enter, anticipating a reversal.
Limitations to Keep in Mind
- The Bearish Stalled pattern alone does not guarantee reversal.
- Without confirmation, it may represent only consolidation.
- Should be combined with other indicators (RSI, MACD, moving averages) for stronger signals.
Final Thoughts
The Bearish Stalled candlestick pattern is a subtle but important warning sign of weakening bullish momentum. Recognizing it at the top of an uptrend helps traders prepare for potential reversals and manage risk effectively.