
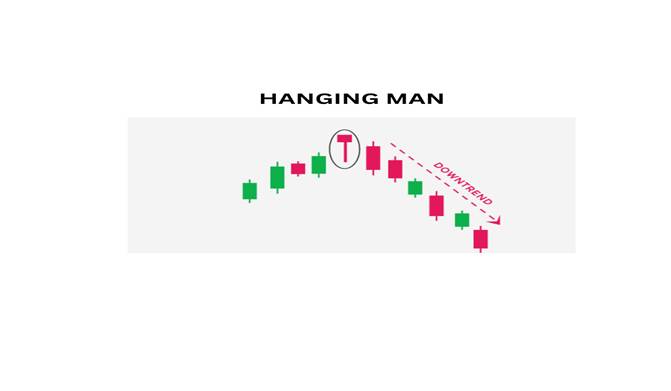
Hanging Man
The Hanging Man resembles the Hammer pattern but occurs after a rally. It signals that sellers attempted to push prices lower during the session, and although buyers regained control, the long lower shadow reveals underlying selling pressure.
Candle Structure Breakdown
- Shape: Small body near the top of the range with a long lower shadow (at least twice the body length).
- Upper Shadow: Very short or nonexistent.
- Color: Can be green (neutral) or red (bearish), but a red body adds strength to the signal.
This structure visually resembles a “hanging man,” symbolizing vulnerability at the peak of an uptrend.
Key Traits to Recognize
- Appears after a prolonged rally or strong bullish move.
- The long lower shadow shows sellers testing lower prices.
- Stronger when confirmed by a bearish candle in the next session.
Market Psychology Behind the Pattern
- Buyers dominate early, pushing prices upward.
- Sellers step in, driving prices down significantly during the session.
- Buyers recover some ground, but the long lower wick reveals hidden selling pressure.
- This shift suggests a weakening of bullish momentum.
Limitations to Keep in Mind
- A Hanging Man alone doesn’t guarantee reversal — confirmation is essential.
- Works best in liquid markets with clear trends.
- Should be combined with other indicators (RSI, MACD, moving averages, or volume analysis).
Final Thoughts
The Hanging Man candlestick pattern is a subtle but important bearish reversal signal. Recognizing it at the top of an uptrend can help traders anticipate downturns and adjust their strategies with caution.