
Introduction
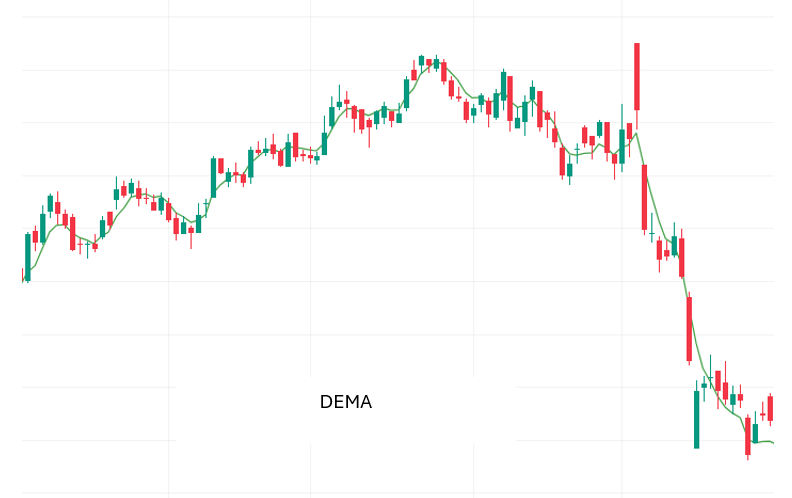
The Double Exponential Moving Average (DEMA) is a trend-following technical indicator developed by Patrick Mulloy in 1994. It was designed to reduce the lag commonly associated with traditional moving averages, making it more responsive to price changes. Traders use DEMA to identify trends, generate buy/sell signals, and improve timing in volatile markets.
Structure of the DEMA Indicator
The DEMA is calculated using a combination of single and double exponential moving averages:
[ DEMA = 2 EMA – EMA(EMA) ]
Where:
- EMA = Exponential Moving Average
- EMA(EMA) = EMA of the EMA itself
This formula reduces lag by subtracting the smoothed EMA from twice the EMA, creating a faster-moving line that reacts more quickly to price changes.
Key Features
- Reduced Lag: Provides faster signals compared to simple or exponential moving averages.
- Trend Identification: Highlights bullish and bearish phases clearly.
- Versatility: Works across multiple timeframes and asset classes.
- Crossover Signals: Often used with another moving average to generate buy/sell signals.
- Noise Filtering: Smooths price data while remaining responsive.
How It Helps Traders
- Early Signal Generation: Helps traders spot trend changes faster than traditional moving averages.
- Entry & Exit Timing: Crossovers between DEMA and price or another moving average provide clear buy/sell triggers.
- Trend Confirmation: Positive slope indicates bullish momentum, while negative slope signals bearish sentiment.
- Risk Management: Reduces false signals by filtering noise, improving trade discipline.
- Strategy Integration: Works well with oscillators like RSI or MACD for layered confirmation.
Conclusion
The Double Exponential Moving Average is a powerful trend-following tool that balances responsiveness with accuracy. By reducing lag, it allows traders to act on signals more quickly than with traditional moving averages. While DEMA should not be used in isolation, combining it with other indicators enhances reliability and confidence. For traders seeking sharper entry and exit points, the DEMA Indicator offers a structured framework to navigate bullish and bearish markets with precision.