

Introduction
The FibTrend Indicator is a technical analysis tool that integrates Fibonacci retracement and extension levels with trend-following logic to help traders identify potential support, resistance, and continuation zones. It is designed to highlight areas where price is likely to react, making it easier to spot trend strength, reversals, and breakout opportunities. By combining Fibonacci mathematics with trend analysis, the FibTrend Indicator provides a structured framework for disciplined trading.
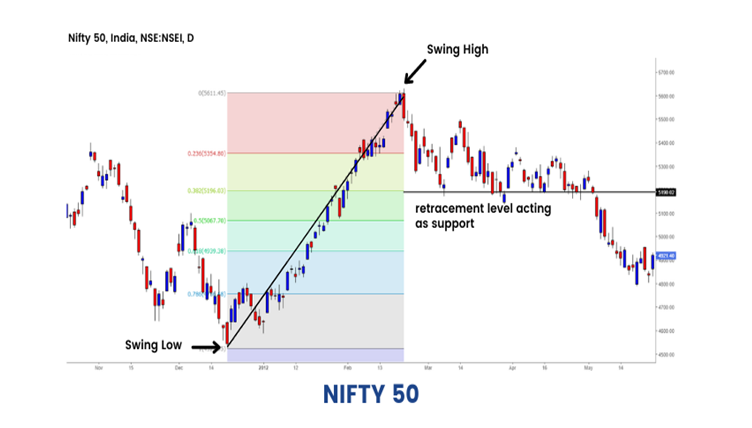
Structure of the FibTrend Indicator
The FibTrend Indicator typically consists of:
- Fibonacci Levels: Key retracement zones (38.2%, 50%, 61.8%, 78.6%) and extension levels (127.2%, 161.8%).
- Trend Filter: Often uses moving averages or directional filters to confirm trend direction.
- Signal Zones:
- Bullish Trend: Price holds above Fibonacci retracement levels and continues upward.
- Bearish Trend: Price fails at Fibonacci resistance and moves downward.
- Breakout Confirmation: Price crossing beyond Fibonacci extensions validates trend continuation.
This structure ensures that signals are not just based on price levels but are reinforced by trend strength.
Key Features
- Dual Analysis: Combines Fibonacci retracement/extension with trend-following confirmation.
- Support & Resistance Mapping: Highlights key levels where price is likely to react.
- Trend Strength Detection: Confirms whether moves are genuine or weakening.
- Noise Reduction: Filters false signals by requiring alignment with Fibonacci zones.
- Versatility: Works across multiple timeframes and asset classes.
How It Helps Traders
- Entry & Exit Points: Provides precise signals when price reacts at Fibonacci levels within a trend.
- Trend Validation: Confirms whether price moves are supported by momentum.
- Reversal Detection: Identifies when price fails to sustain beyond Fibonacci levels, signaling potential pullbacks.
- Risk Management: Helps traders set stop-loss levels near Fibonacci support/resistance zones.
- Strategy Integration: Works well with oscillators like RSI or MACD for layered confirmation.
Conclusion
The FibTrend Indicator is a powerful hybrid tool that merges Fibonacci mathematics with trend-following analysis to deliver disciplined trading signals. By requiring alignment between price action and Fibonacci levels, it reduces noise and enhances accuracy. While it should not be used in isolation, combining it with momentum or volume-based indicators strengthens reliability. For traders seeking to capture high-probability breakout and reversal opportunities, the FibTrend Indicator offers a structured framework to navigate bullish and bearish markets with confidence.
