
In-Neck Pattern
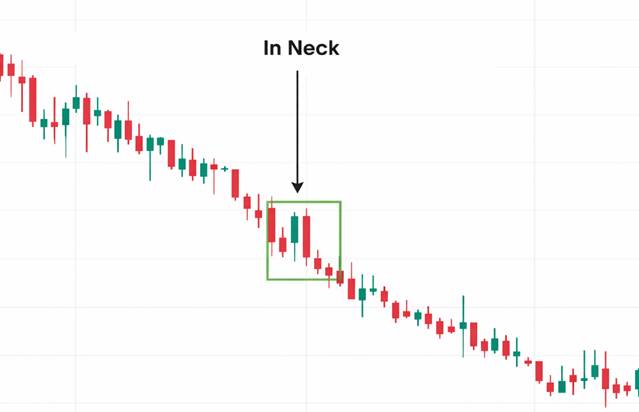
The In-Neck is a two-candle formation where a strong bearish candle is followed by a bullish candle that opens lower but closes just above the prior candle’s close. Despite the bullish attempt, the close is weak, reinforcing bearish sentiment.
Candle Formation Breakdown
- First Candle: A long bearish (red/black) candle continuing the downtrend.
- Second Candle:
- Opens below the prior candle’s low (gap down).
- Closes slightly above the prior candle’s close, but not above its midpoint.
- Forms a small bullish (green/white) candle.
Key Traits to Recognize
- Appears during a downtrend.
- The second candle shows a weak bullish attempt, quickly rejected.
- The close near the prior candle’s level signals bearish continuation.
- Stronger when confirmed by subsequent bearish candles or volume spikes.
Market Psychology Behind the Pattern
- Sellers dominate initially (first candle).
- Buyers attempt a recovery with a gap down open and modest close.
- The weak close shows buyers lack conviction.
- Interpretation: Sellers remain in control, and the downtrend is likely to continue.
Limitations to Keep in Mind
- The In-Neck pattern is rare and may not appear often in liquid markets.
- Without confirmation, it may represent only short-term consolidation.
- Should be combined with other indicators (RSI, MACD, moving averages) for stronger signals.
Final Thoughts
The In-Neck candlestick pattern is a subtle but reliable bearish continuation signal. Recognizing it during a downtrend can help traders anticipate further declines and position themselves accordingly.