
Introduction
The Percentage Price Oscillator (PPO) Histogram Crossovers Indicator is a momentum-based technical analysis tool derived from the PPO. While the PPO itself measures the difference between two exponential moving averages (EMAs) as a percentage of price, the histogram visually represents the gap between the PPO line and its signal line. The crossover signals occur when the histogram moves above or below zero, providing traders with clear buy/sell triggers. This makes the PPO Histogram Crossovers Indicator especially useful for identifying momentum shifts and trend reversals.
Structure of the PPO Histogram Crossovers Indicator
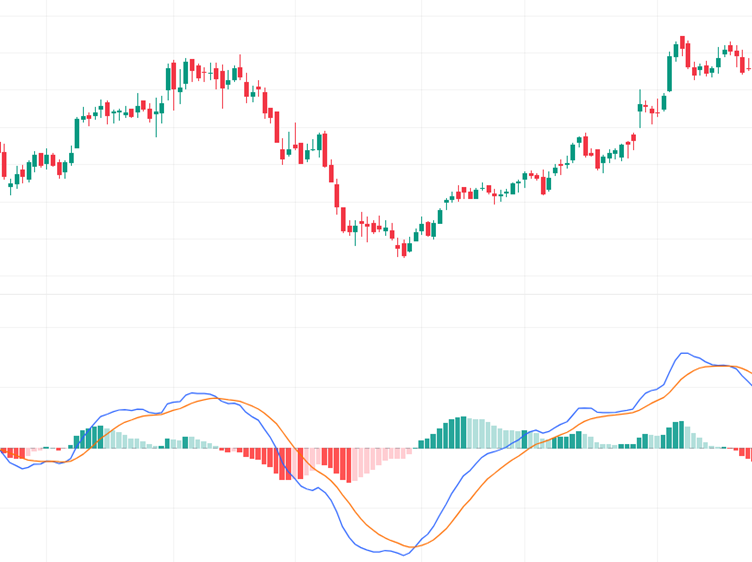
The indicator is built using:
- PPO Line → Difference between two EMAs (commonly 12-period and 26-period), expressed as a percentage.
- Signal Line → A 9-period EMA of the PPO line.
- Histogram → PPO Line – Signal Line.
- Crossover Signals:
- Bullish Signal → Histogram crosses above zero (PPO above Signal Line).
- Bearish Signal → Histogram crosses below zero (PPO below Signal Line).
This structure provides both momentum measurement and visual clarity for traders.
Key Features
- Percentage-Based: Normalizes values, making it easier to compare across assets.
- Histogram Visualization: Highlights momentum strength and direction.
- Crossover Clarity: Provides straightforward buy/sell signals.
- Trend Sensitivity: Expands during strong moves, contracts during consolidation.
- Versatility: Works across multiple timeframes and asset classes.
How It Helps Traders
- Trend Identification: Confirms whether momentum supports bullish or bearish sentiment.
- Entry & Exit Points: Histogram crossovers provide disciplined trade timing.
- Risk Management: Reduces false signals by requiring confirmation of momentum shifts.
- Reversal Detection: Shrinking histogram bars often signal weakening momentum before reversals.
- Strategy Integration: Works well with RSI, MACD, or volume indicators for layered confirmation.
Conclusion
The PPO Histogram Crossovers Indicator is a powerful blend of momentum analysis and crossover signals, offering traders a structured way to identify trend shifts and refine trade timing. Its percentage-based calculation makes it more adaptable than absolute-value indicators like MACD, allowing for cross-asset comparison. While it should not be used in isolation, combining PPO Histogram Crossovers with trend-following or volatility-based tools enhances accuracy and confidence. For traders seeking a disciplined, momentum-driven approach to market analysis, the PPO Histogram Crossovers Indicator provides a reliable framework to navigate bullish and bearish markets effectively.