

Introduction
Technical Analysis Stochastic RSI combines the stochastic oscillator with the Relative Strength Index RSI to create a highly sensitive momentum indicator.
Unlike standard RSI, Stochastic RSI measures RSI momentum itself, making it faster and more responsive.
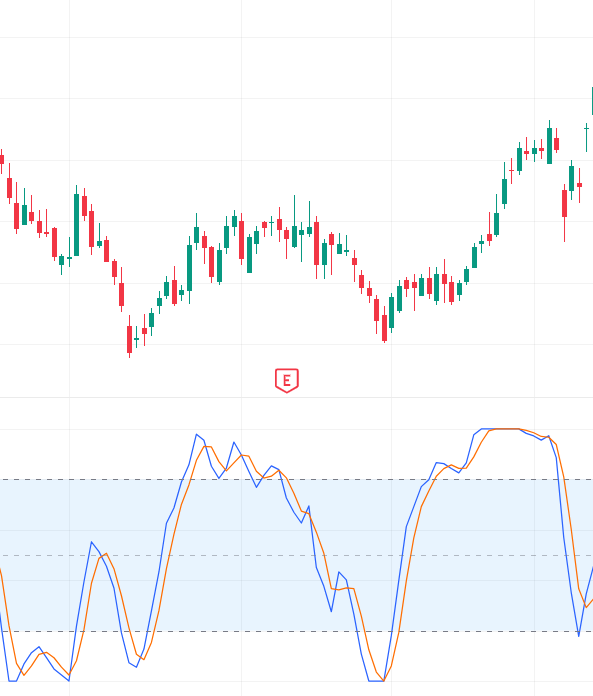
Structure
The formula is:

- RSI → Current Relative Strength Index value (commonly 14‑period).
- min(RSI) → Lowest RSI value over the look‑back period (e.g., 14 days).
- max(RSI) → Highest RSI value over the same look‑back period.
- The result is usually scaled between 0 and 1 (or multiplied by 100 to show 0–100)
Features
High Sensitivity Responds quickly to momentum changes, making it ideal for short‑term trading setups.
Overbought & Oversold Signals Rapidly detects reversal zones, helping traders spot potential turning points.
Short‑Term Trading Utility Widely used by scalpers and intraday traders for fast opportunities.
Momentum Acceleration Analysis Measures the speed of RSI changes, offering deeper insight into trend strength.
Interpolation Smoothing Reduces noise and improves readability, ensuring clearer signals.
Fast Signal Generation Captures quick market shifts, allowing traders to act before larger moves unfold.
How It Helps Traders
Stochastic RSI helps traders identify rapid momentum changes before traditional RSI reacts. Scalpers and intraday traders especially value its responsiveness.
Conclusion
Stochastic RSI is a highly sensitive momentum oscillator that enhances RSI analysis with stochastic calculations. Its fast signals and interpolation smoothing make it ideal for active traders seeking rapid momentum insights.
