
Dragonfly Doji
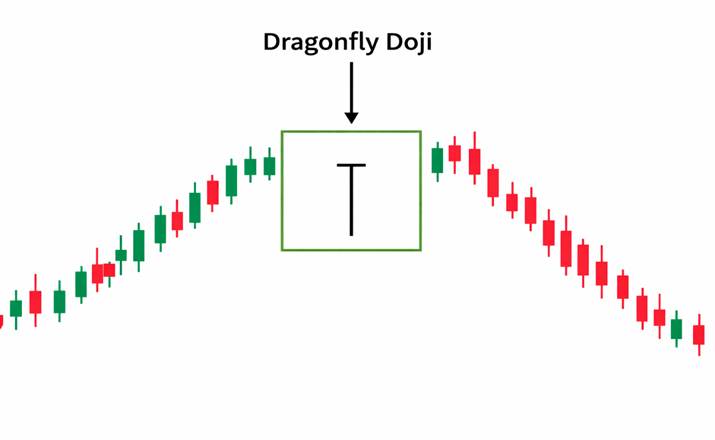
The Dragonfly Doji is a single-candle formation where the opening, closing, and high prices are nearly equal, leaving a long lower shadow and no upper shadow. It visually resembles a dragonfly, with its wings at the top and a long tail below.
Candle Structure Breakdown
- Body: Extremely small or nonexistent, showing equal open and close.
- Upper Shadow: None or very minimal.
- Lower Shadow: Long, at least twice the body length.
This structure reflects strong rejection of lower prices.
Key Traits to Recognize
- Appears after a downtrend or extended selling pressure.
- The long lower shadow shows buyers stepping in after sellers pushed prices down.
- Stronger when confirmed by a bullish candle in the next session.
Market Psychology Behind the Pattern
- Sellers dominate early, driving prices sharply lower.
- Buyers regain control, pushing prices back up to the open level.
- This tug-of-war signals loss of bearish momentum and renewed buying interest.
Limitations to Keep in Mind
- The Dragonfly Doji is rare; traders may not encounter it often.
- Without confirmation, it may indicate only short-term indecision.
- Should be combined with other indicators (RSI, MACD, moving averages, or volume analysis).
Final Thoughts
The Dragonfly Doji candlestick pattern is a subtle but powerful bullish reversal signal. Recognizing it at the bottom of a downtrend can help traders anticipate market turnarounds and position themselves for early entry into emerging uptrends.