

Introduction
The TrendLine Indicator is a technical analysis tool designed to automatically plot and track trend lines based on price action. Unlike manually drawn lines, this indicator dynamically adjusts as new highs and lows form, giving traders a real-time view of market direction. It is widely used to identify support and resistance zones, confirm breakout signals, and highlight the strength of ongoing trends.
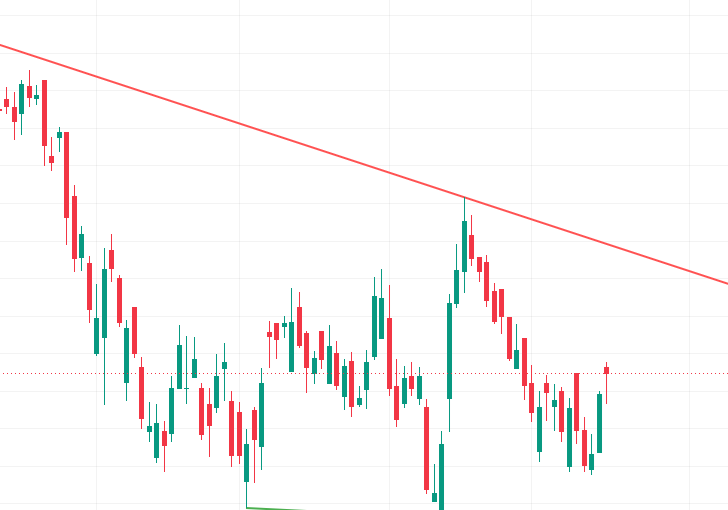
Structure of the TrendLine Indicator
The indicator is typically constructed using:
- Swing Highs & Lows → Detects pivot points in price movement.
- Trend Line Calculation → Connects consecutive highs (for resistance) or lows (for support).
- Dynamic Updates → Adjusts automatically as new price data emerges.
- Breakout Signals → Highlights when price crosses above or below a trend line.
This structure ensures traders can visualize both short-term and long-term market direction without manually redrawing lines.
Key Features
- Automatic Trend Line Plotting: Saves time and reduces subjectivity compared to manual drawing.
- Support & Resistance Mapping: Identifies critical levels where price often reacts.
- Breakout Detection: Signals potential entry points when price breaches a trend line.
- Noise Reduction: Focuses on meaningful pivots rather than minor fluctuations.
- Versatility: Works across multiple timeframes and asset classes.
How It Helps Traders
- Trend Identification: Confirms whether the market is in an uptrend, downtrend, or sideways phase.
- Entry & Exit Points: Provides disciplined trade timing when price interacts with trend lines.
- Risk Management: Trend lines act as logical zones for stop-loss placement.
- Reversal Detection: Helps spot weakening momentum when price fails to break or hold trend lines.
- Strategy Integration: Works well with oscillators (RSI, MACD) or volatility tools (ATR, Bollinger Bands) for layered confirmation.
Conclusion
The TrendLine Indicator is a powerful and adaptive tool that simplifies the process of tracking market direction. By automatically plotting trend lines, it eliminates subjectivity and provides traders with a clear framework for identifying trends, reversals, and breakout opportunities. Its ability to highlight support and resistance zones makes it invaluable for both short-term and long-term strategies. While it should not be used in isolation, combining TrendLine with momentum or volume-based indicators enhances accuracy and confidence. For traders seeking a disciplined, trend-focused approach to market analysis, the TrendLine Indicator offers a reliable framework to navigate bullish and bearish markets effectively.
