

If you’ve ever wondered what it looks like when a portfolio is built purely on data no gut feeling, no guesswork, just rules Velocity Vector is a good case study. It’s a model portfolio strategy from Generate Wealth that leans into momentum: stocks that are already moving, moving strongly, and showing signs they can keep going.
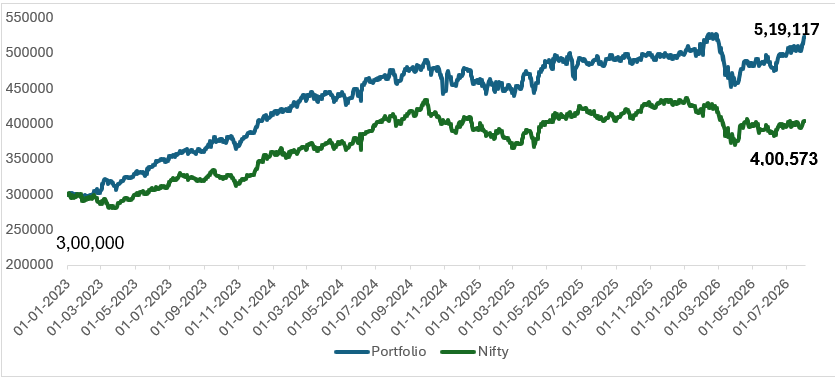
Here’s a closer look at how it works, and how it has performed since its 1 January 2023 inception, based on the August 2026 factsheet.
What Is Velocity Vector?
Velocity Vector is a high-risk equity strategy that focuses on high-momentum stocks within the Nifty 50, layered with a volatility check to help manage risk. In plain terms: it’s a portfolio designed to ride strength in the market’s most active large-cap names, while keeping an eye on how much they’re swinging around.
It’s worth flagging upfront — this isn’t a one-size-fits-all product. It’s explicitly not tailored to any specific investor profile, and the minimum recommended investment is ₹3,00,000. On the risk spectrum, it sits toward the “Very High Risk” end of the scale.
The Research Framework Behind It
Rather than relying on subjective calls, Velocity Vector is built using what’s called the RHOMB Technical Research Framework — a proprietary, rules-based system. It breaks down into a few core components:
1.Price Boundary Model This identifies upper and lower price limits for a stock, helping flag when it’s consolidating within a range or potentially breaking out of one.
2.Momentum Strength Assessment Each stock is scored using a rule-based momentum indicator, comparing its price behavior against its peers to find the ones showing genuine strength.
3.Rule-Driven Inclusion Criteria A stock only makes it into the portfolio if it satisfies RHOMB’s predefined technical conditions, based on pattern recognition and mathematical filters. It’s a systematic process, not a discretionary one.
4.Constituent Weighting Weights within the portfolio are assigned according to the model’s internal rules, not based on any individual investor’s needs or suitability.
How Has It Performed?
This is usually the part everyone jumps to, so let’s get into the numbers — with the caveat that everything below is illustrative and, per the factsheet, may include back-tested or hypothetical results rather than actual trades.
A hypothetical ₹3,00,000 invested on 1 January 2023 would have grown to:
- ₹5,19,117 in Velocity Vector
- ₹4,00,573 in the Nifty 50 (benchmark)
That works out to a since-inception holding period return of 73.04% for Velocity Vector versus 33.06% for the Nifty 50.
Breaking it down by period:
| Period | Velocity Vector CAGR | Velocity Vector HPR | Nifty 50 CAGR | Nifty 50 HPR |
|---|---|---|---|---|
| 6 Months | — | 0.13% | — | -4.32% |
| 1 Year | 5.24% | 5.24% | -2.17% | -2.17% |
| 3 Year | 12.55% | 42.58% | 7.42% | 23.95% |
| Since Inception | 16.55% | 73.04% | 8.31% | 33.06% |
A couple of things stand out. Over the trailing 6 months, the strategy barely moved (+0.13%) while the Nifty 50 actually lost ground (-4.32%) — a reminder that even a momentum-driven portfolio can go quiet or defensive when the broader market is struggling. The longer-term numbers tell a more consistent story of outperformance, though the maximum drawdown of -3.35% is worth keeping in mind as a sign of how sharply things can pull back.
Where the Money Is Parked
Sector allocation shows a strategy that’s heavily concentrated rather than broadly diversified:
| Sector | Weightage |
|---|---|
| Financial Services | 58.41% |
| FMCG | 15.07% |
| Information Technology | 9.93% |
| Healthcare | 6.41% |
| Utilities / Power | 4.35% |
| Diversified | 3.14% |
| Materials / Commodities | 2.26% |
| Services | 0.42% |
Financial Services alone makes up well over half the portfolio which makes sense for a momentum strategy tracking the Nifty 50, where financials carry heavy weight, but it also means the portfolio’s fortunes are closely tied to how that one sector performs.
The Bigger Picture
Velocity Vector is a clear example of rules-based, technically-driven investing: no narrative-chasing, no forecasting — just a systematic process for identifying and weighting momentum. The since-inception numbers show it has outpaced its Nifty 50 benchmark, but the flatter recent 6-month stretch and the concentrated sector exposure are useful reminders that performance isn’t a straight line, and a high-risk momentum strategy can have quiet or bumpy patches even inside a longer winning streak.
As always with model portfolios: past performance shown here is based on back-tested methodology, doesn’t guarantee future results, and doesn’t reflect brokerage or other costs. Anyone considering a strategy like this should weigh it against their own risk appetite, given its “Very High Risk” rating and steep minimum investment.
This article is based on the Velocity Vector August 2026 Model Portfolio Factsheet and is for informational purposes only. It is not investment advice.
Stay Informed, Stay Ahead
Markets move fast don’t miss the moves that matter. Get the latest global and Indian market news delivered straight to your inbox, before it becomes yesterday’s story.
Want to see exactly what’s inside Velocity Vector right now?
Explore the live holdings, weights, and latest rebalancing no guesswork required.