

Introduction
The Trend Line 252 Indicator is a long-term technical analysis tool that uses a 252-period calculation, which corresponds to approximately one full trading year (252 trading days in most markets). By focusing on this extended timeframe, the indicator helps traders and investors identify major market trends, filter out short-term noise, and align strategies with broader market direction. It is particularly valuable for portfolio managers and swing traders who want to track annual momentum and stability.
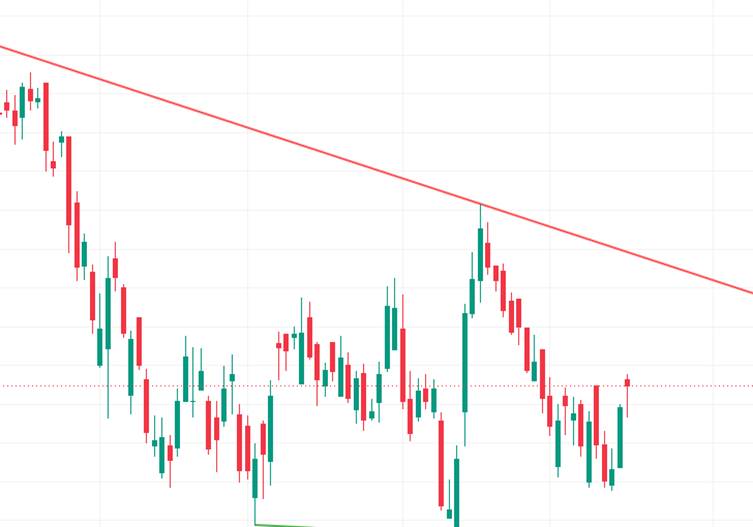
Structure of the Trend Line 252 Indicator
The Trend Line 252 is typically constructed using:
- Price Data → Daily closing prices over 252 trading sessions.
- Calculation → A moving average or regression line plotted across the 252-day period.
- Trend Visualization → The line acts as a benchmark, showing whether price is trending upward, downward, or sideways relative to the annual average.
This structure ensures the indicator reflects long-term sentiment rather than short-term fluctuations.
Key Features
- Annual Benchmark: Represents one trading year’s worth of data.
- Noise Reduction: Filters out short-term volatility to highlight major trends.
- Support & Resistance: Acts as a dynamic level where price often reacts.
- Trend Sensitivity: Shows whether the market is in a sustained bullish or bearish phase.
- Versatility: Works across equities, commodities, forex, and indices.
How It Helps Traders
- Long-Term Trend Identification: Confirms whether the broader market is bullish or bearish.
- Entry & Exit Points: Provides disciplined signals when price crosses above or below the 252-day line.
- Risk Management: Helps traders avoid counter-trend trades by aligning with the dominant direction.
- Portfolio Strategy: Useful for fund managers to benchmark performance against annual market trends.
- Reversal Detection: Sustained breaks of the 252 line often signal major shifts in sentiment.
Conclusion
The Trend Line 252 Indicator is a powerful long-term tool that offers traders and investors a clear view of annual market direction. By smoothing out short-term volatility, it highlights the underlying trend and provides actionable insights for timing entries, exits, and portfolio adjustments. While it should not be used in isolation, combining the Trend Line 252 with momentum or volume-based indicators enhances accuracy and confidence. For traders seeking a disciplined, big-picture approach to market analysis, the Trend Line 252 Indicator provides a reliable framework to navigate bullish and bearish markets effectively.
