
Introduction
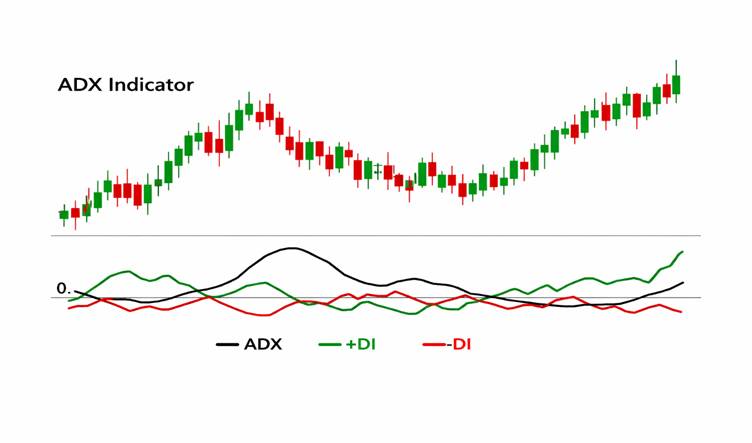
The Average Directional Index (ADX), developed by J. Welles Wilder, is a trend-strength indicator. Unlike oscillators that measure momentum, ADX focuses on the strength of a trend, regardless of its direction. It is widely used to distinguish between trending and non-trending markets.
Structure
- Components:
- +DI (Positive Directional Indicator)
- –DI (Negative Directional Indicator)
- ADX (Average of Directional Movement Index)
- Formula: ADX is derived from smoothed averages of directional movement over a chosen period (commonly 14).
- Plotted as a line ranging from 0 to 100.
Features
- Trend Strength Gauge:
- ADX < 20 → Weak/sideways market.
- ADX 20–40 → Moderate trend.
- ADX > 40 → Strong trend.
- Direction Clarity: +DI above –DI signals bullish trend; –DI above +DI signals bearish trend.
- Versatility: Works across all asset classes and timeframes.
How It Helps Traders
ADX helps traders decide whether to use trend-following or range-bound strategies. For example, a rising ADX above 25 confirms a strong trend, making moving average crossovers or breakout strategies more effective. Conversely, a low ADX warns traders to avoid trend-based systems and focus on oscillators like RSI. It also aids in risk management by identifying periods of high trend strength.
Conclusion
The ADX is a cornerstone indicator for trend analysis. By measuring trend strength rather than direction, it helps traders adapt strategies to market conditions. When combined with +DI and –DI, it provides a complete framework for identifying bullish or bearish phases and gauging their intensity.