
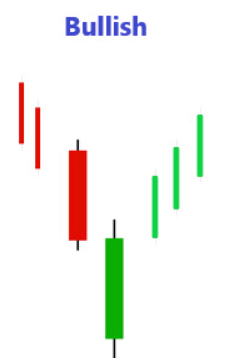
Bullish Counterattack
The Bullish Counterattack is a two-candle reversal pattern that appears after a downtrend. It shows that sellers initially push prices lower, but buyers step in strongly to counter the move, closing at the same level as the prior candle’s close.
Candle Formation Breakdown
- First Candle: A long bearish candle, confirming strong selling pressure.
- Second Candle: A long bullish candle that opens lower but closes at the same level as the first candle’s close, signaling buyer strength.
Key Traits to Recognize
- Appears after a downtrend.
- The second candle’s close matches the first candle’s close (a defining feature).
- Shows strong buyer conviction after initial weakness.
- Stronger when confirmed by high trading volume on the second candle.
Market Psychology Behind the Pattern
- Sellers dominate initially, driving prices lower.
- Buyers step in aggressively, pushing prices back up.
- The equal closing level reflects a direct counterattack against sellers.
- Interpretation: A potential reversal point where buyers regain control.
Limitations to Keep in Mind
- The Bullish Counterattack is rare due to its precise closing alignment requirement.
- Without confirmation, it may represent only short-term strength.
- Should be combined with other indicators (RSI, MACD, moving averages) for stronger signals.
Final Thoughts
The Bullish Counterattack candlestick pattern is a powerful reversal signal that highlights buyer resilience. Recognizing it at the bottom of a downtrend helps traders anticipate potential recoveries and adjust their strategies effectively.