
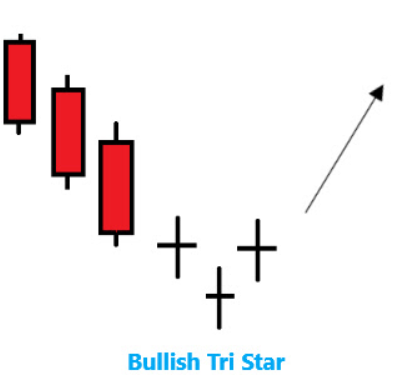
Bullish Tri-Star
The Bullish Tri-Star is a three-doji candlestick pattern that appears after a bearish decline. It represents extreme indecision in the market, often followed by a bullish reversal.
Candle Formation Breakdown
- First Candle: A doji appearing after a downtrend, showing hesitation.
- Second Candle: Another doji that gaps below the first, highlighting uncertainty and lack of conviction.
- Third Candle: A doji that gaps above the second, completing the tri-star formation.
Key Traits to Recognize
- Appears at the bottom of a downtrend.
- All three candles are dojis (open and close nearly equal).
- Each doji gaps away from the previous one, forming a “star-like” sequence.
- Stronger when followed by a bullish confirmation candle.
Market Psychology Behind the Pattern
- Sellers dominate the trend, but indecision emerges (first doji).
- The second doji shows lack of follow-through, despite the gap down.
- The third doji confirms exhaustion, as neither buyers nor sellers dominate.
- Buyers interpret this as a signal to enter, anticipating reversal.
Limitations to Keep in Mind
- The Bullish Tri-Star is extremely rare due to its precise doji and gap requirements.
- Without confirmation, it may represent only consolidation.
- Should be combined with other indicators (RSI, MACD, moving averages) for stronger signals.
Final Thoughts
The Bullish Tri-Star candlestick pattern is a rare but powerful warning of trend exhaustion. Recognizing it at the bottom of a downtrend helps traders prepare for potential reversals and