
Introduction
The Fisher Transform Indicator, developed by John Ehlers, is a technical analysis tool that converts price data into a Gaussian normal distribution. By doing so, it sharpens turning points and makes them more visually identifiable compared to traditional oscillators. The Fisher Transform is particularly popular among traders because it highlights potential reversals with greater clarity, helping them anticipate market shifts more effectively.
Structure of the Fisher Indicator
The Fisher Transform is calculated using:
- Price Normalization: Price is scaled relative to its high-low range over a chosen period.
- Mathematical Transformation: The normalized price is converted using a logarithmic function to approximate a Gaussian distribution.
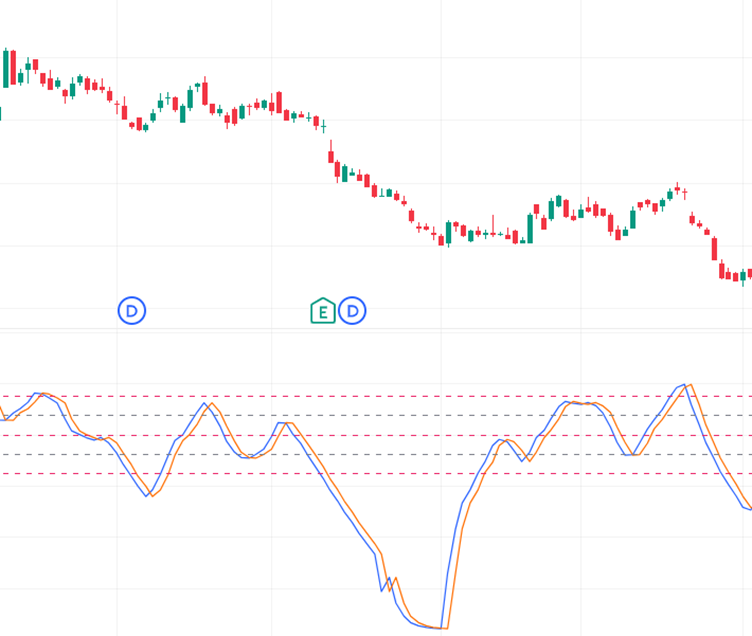
- Signal Line: Often paired with a moving average of the Fisher values to generate crossover signals.
Interpretation:
- Positive Values → Indicate bullish momentum.
- Negative Values → Indicate bearish momentum.
- Crossovers → Fisher line crossing the signal line suggests potential buy/sell opportunities.
Key Features
- Sharp Turning Points: Makes reversals more visible compared to smoother oscillators.
- Crossover Signals: Provides clear buy/sell triggers when Fisher crosses its signal line.
- Versatility: Works across multiple timeframes and asset classes.
- Noise Reduction: Filters out random fluctuations by focusing on normalized price data.
- Integration Friendly: Often paired with trend-following indicators for confirmation.
How It Helps Traders
- Reversal Detection: Identifies turning points earlier than many traditional oscillators.
- Entry & Exit Timing: Crossover signals provide disciplined buy/sell opportunities.
- Trend Confirmation: Positive Fisher values confirm bullish sentiment, while negative values confirm bearish sentiment.
- Risk Management: Helps traders avoid false signals by requiring confirmation from other indicators.
- Strategy Integration: Works well with MACD, RSI, or moving averages for layered confirmation.
Conclusion
The Fisher Transform Indicator is a powerful oscillator that enhances reversal detection by transforming price data into a Gaussian distribution. Its sharp turning points and crossover signals make it a valuable tool for traders seeking precise entry and exit opportunities. While it should not be used in isolation, combining Fisher with trend-following or volume-based indicators strengthens reliability. For traders aiming to anticipate market reversals and act with confidence, the Fisher Indicator offers a structured framework to navigate bullish and bearish phases effectively.