
Introduction
The Parabolic Stop and Reverse (Parabolic SAR) Strategy is a trend-following indicator developed by J. Welles Wilder. It is designed to identify potential entry and exit points by tracking the direction of price movement. The indicator appears as a series of dots placed above or below price candles, visually guiding traders on when to stay in a trade and when to reverse their position. Its simplicity and clarity make it a favorite among traders who rely on trend momentum.
Structure of the Strategy
The Parabolic SAR is structured around the following rules:
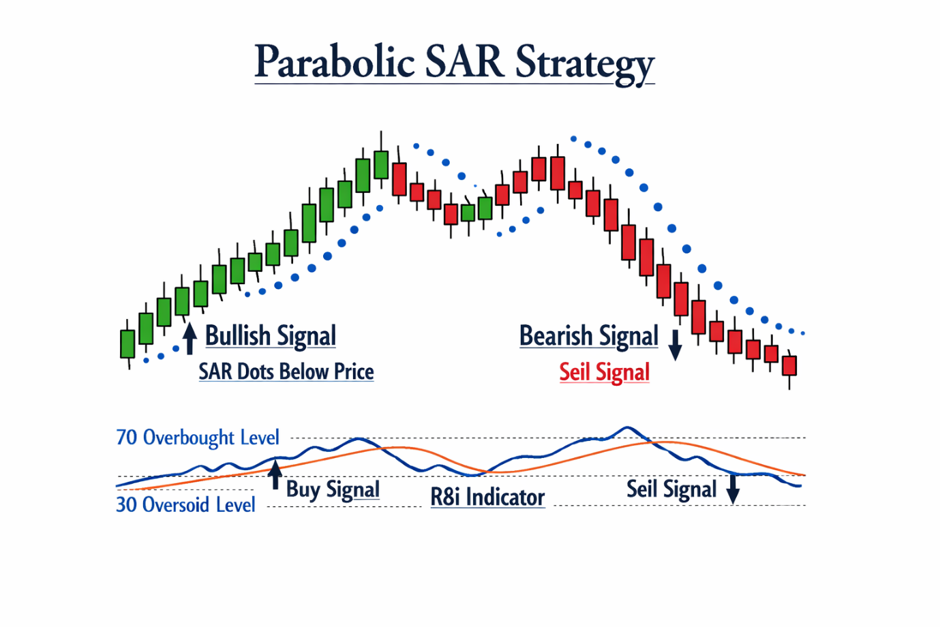
- Dots Below Price: Indicate bullish momentum, suggesting long positions.
- Dots Above Price: Indicate bearish momentum, signaling short positions.
- Stop and Reverse Mechanism: When dots flip from below to above (or vice versa), it signals a potential reversal.
- Trailing Stop Functionality: The dots act as dynamic stop-loss levels, moving closer to price as the trend progresses.
Key Features
- Clear Visual Signals: Easy-to-read dots for entry and exit points.
- Trend-Following Nature: Works best in strong trending markets.
- Dynamic Stop-Loss: Provides automatic trailing stops to protect profits.
- Versatility: Applicable across stocks, forex, commodities, and indices.
- Combination-Friendly: Often paired with moving averages, RSI, or MACD for confirmation.
How It Helps Traders
- Entry & Exit Guidance: Offers straightforward buy/sell signals based on dot placement.
- Risk Management: Acts as a trailing stop, helping traders lock in profits.
- Trend Participation: Keeps traders aligned with prevailing momentum.
- Reversal Detection: Signals when a trend may be ending and a new one beginning.
- Confidence Building: Reduces emotional bias by providing rule-based signals.
Conclusion
The Parabolic SAR Strategy is a powerful tool for traders seeking clarity in trend-following systems. By visually marking potential reversals and providing dynamic stop-loss levels, it simplifies decision-making and enhances risk management. While it performs best in trending markets, it can produce false signals in sideways conditions. Combining Parabolic SAR with other indicators like moving averages or momentum oscillators improves accuracy and reliability. For traders aiming to capture sustained moves while maintaining discipline, the Parabolic SAR Strategy offers a structured, rule-based pathway to confident trading.