
Introduction
The Price–Volume Indicator is a technical analysis tool that integrates both price movement and trading volume into a single framework. While price alone can show direction, volume reveals the conviction behind that move. PVOL bridges the two, helping traders identify whether rallies or declines are supported by meaningful participation. This makes it particularly useful in spotting false breakouts or confirming genuine trends.
Structure
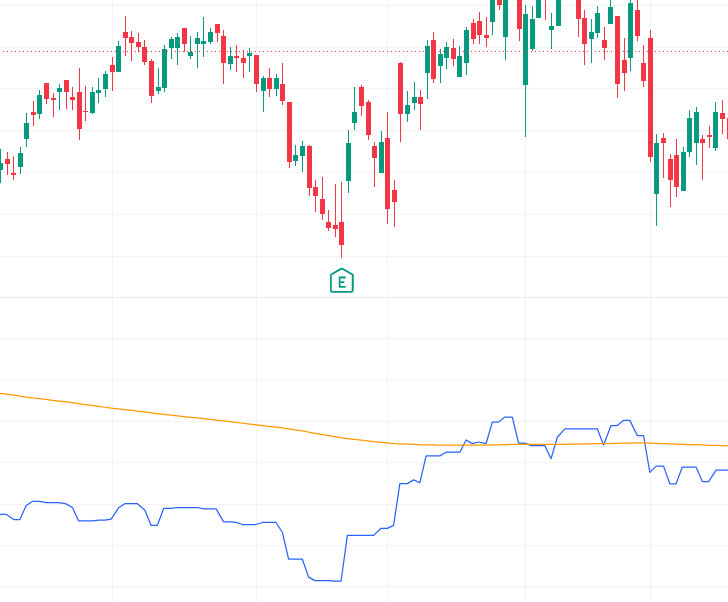
PVOL is typically calculated by multiplying price changes with corresponding volume levels, then smoothing the results with moving averages. The logic is simple: large price moves on high volume carry more weight than similar moves on low volume. The indicator line rises when price increases are backed by strong volume and falls when declines occur with heavy selling pressure.
Features
- Combines price and volume into one metric.
- Highlights conviction behind market moves.
- Can be smoothed with averages for trend clarity.
- Useful across multiple timeframes.
How it helps traders
PVOL helps traders filter noise. For example, a sharp rally on low volume may be ignored, while a moderate rally on high volume is considered significant. This prevents traders from chasing weak moves and instead focuses attention on sustainable trends. Swing traders use PVOL to confirm breakout strength, while long‑term investors rely on it to validate accumulation phases.
Conclusion
Price–Volume Indicator is a versatile indicator that ensures traders don’t just follow price blindly. By integrating volume, it provides a deeper understanding of market conviction. When combined with oscillators like RSI or MACD, PVOL becomes a powerful confirmation tool, helping traders distinguish between genuine opportunities and deceptive signals.