
Introduction
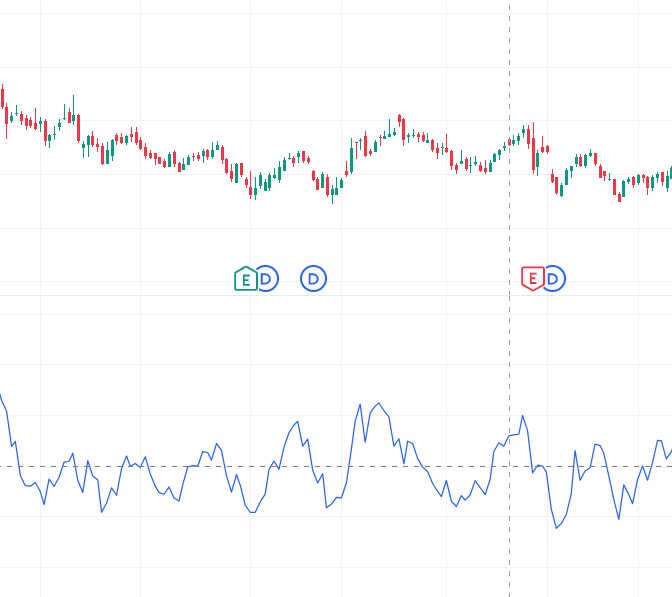
Technical Analysis ROC, or Rate of Change Indicator with interpolation techniques, is a momentum oscillator that measures the percentage change in price between the current price and a previous price over a selected period.
ROC is one of the oldest and most respected momentum indicators in technical analysis. Traders use it to identify accelerating trends, slowing momentum, and possible reversals. Unlike moving averages, ROC focuses on speed and strength of price movement rather than direction alone.
When the ROC rises above zero, momentum is bullish. When it falls below zero, bearish momentum dominates.
Structure
The ROC formula is:
ROC = {Current Price – Previous Price}{Previous Price} * 100
The interpolation layer smooths sharp fluctuations to improve readability.
Features
1. Momentum Measurement
Shows how quickly prices change.
2. Early Trend Detection
Can identify momentum shifts before price reversals occur.
3. Overbought and Oversold Signals
Extreme ROC values may indicate exhaustion.
4. Divergence Analysis
Price and ROC divergence can predict reversals.
5. Zero-Line Crossovers
Simple bullish and bearish signals.
6. Volatility Insight
Highlights explosive price acceleration.
How It Helps Traders
ROC helps traders gauge market speed and momentum intensity. Strong positive readings indicate aggressive buying pressure, while deeply negative values signal strong selling pressure.
Momentum traders often use ROC to confirm breakout strength. If price breaks resistance with rising ROC, the breakout is considered stronger and more reliable.
Swing traders use divergences between ROC and price to identify weakening trends before reversals occur.
Conclusion
ROC is a powerful momentum indicator that measures the speed of price movement and trend acceleration. By helping traders detect momentum changes early, it improves timing and trade confidence. Combined with trend analysis and support/resistance levels, ROC becomes an effective tool for identifying high-probability trading opportunities.