

Introduction
The Vortex Indicator (VI), developed by Etienne Botes and Douglas Siepman in 2010, is a trend-following technical analysis tool designed to identify the start of new trends and confirm existing ones. Inspired by the natural flow of water vortices, the indicator captures directional movement in price by comparing upward and downward forces. Traders use it to spot bullish and bearish trend shifts, making it a versatile addition to both short-term and long-term strategies.
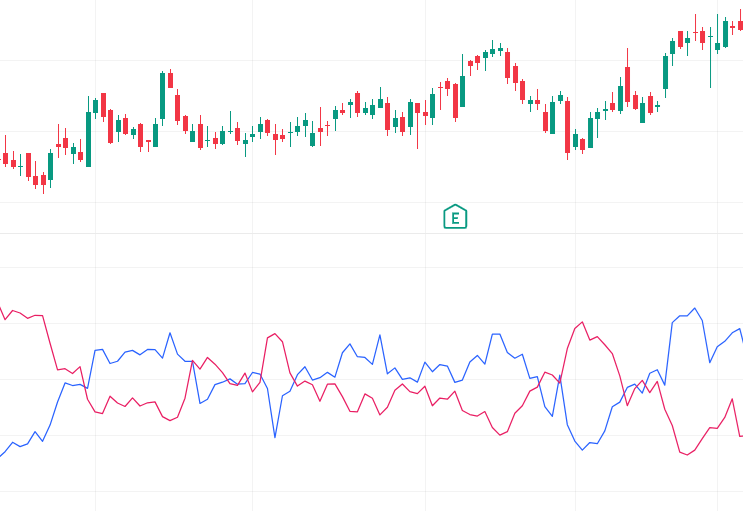
Structure of the Vortex Indicator
The Vortex Indicator is built using:
- True Range (TR) → Measures overall volatility.
- Upward Movement (VM+) → Distance between current high and previous low.
- Downward Movement (VM−) → Distance between current low and previous high.
- Normalized Values → VM+ and VM− are divided by TR and smoothed over a chosen period (commonly 14 days).
- Two Lines → VI+ (bullish line) and VI− (bearish line) plotted on the chart.
- Crossovers between VI+ and VI− indicate potential trend reversals.
- Wide separation between the lines signals strong directional momentum.
Key Features
- Trend Detection: Identifies bullish and bearish phases via line crossovers.
- Momentum Strength: Measures the intensity of price movement.
- Noise Reduction: Filters minor fluctuations by focusing on directional forces.
- Versatility: Works across multiple timeframes and asset classes.
- Visual Simplicity: Two clear lines make interpretation straightforward.
How It Helps Traders
- Trend Identification: Confirms whether the market is in an uptrend or downtrend.
- Entry & Exit Points: Provides disciplined trade timing through crossovers.
- Risk Management: Helps avoid counter-trend trades by aligning with dominant direction.
- Reversal Detection: Early signals when VI+ and VI− cross after consolidation.
- Strategy Integration: Works well with moving averages, RSI, or MACD for layered confirmation.
Conclusion
The Vortex Indicator is a powerful trend-following tool that blends volatility and directional movement into a simple, two-line framework. Its ability to highlight trend shifts and measure momentum strength makes it valuable for traders across all markets. While it should not be used in isolation, combining VI with momentum or volume-based indicators enhances accuracy and confidence. For traders seeking a disciplined, trend-focused approach to market analysis, the Vortex Indicator provides a reliable framework to navigate bullish and bearish markets effectively.
